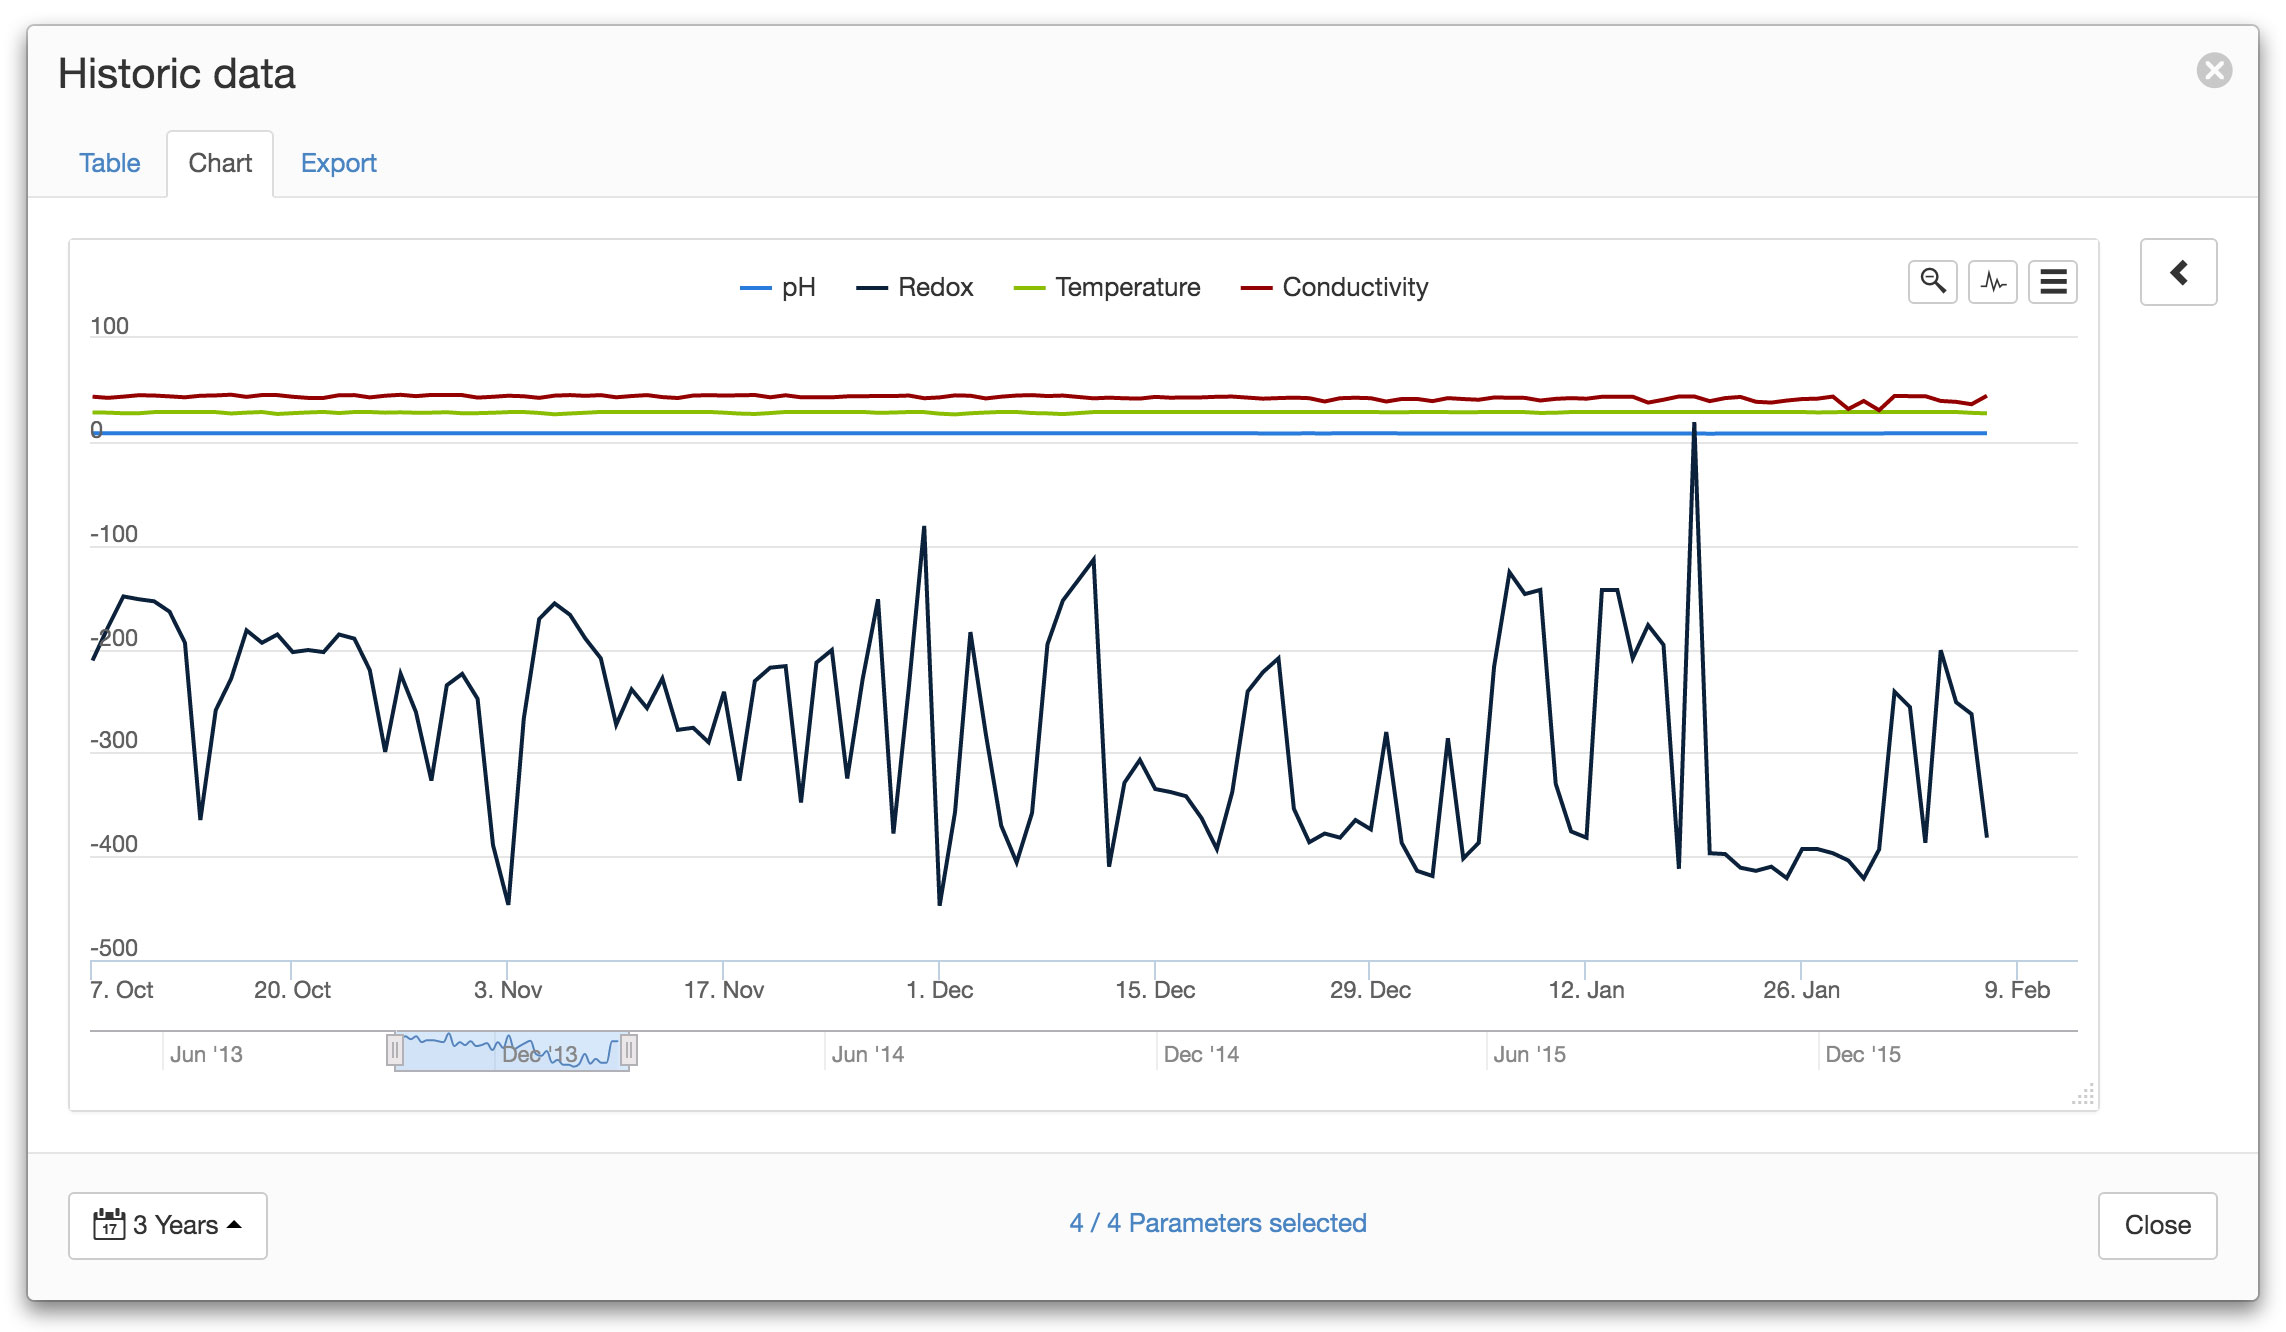
Chart
 Historic chart is accessible from the List View toolbar and Node context menus. The Historic Chart provides the same functionality as the charts displayed in Chart View but can be displayed directly from the Workspaces Tree, Map or List View without navigating away from your current view.
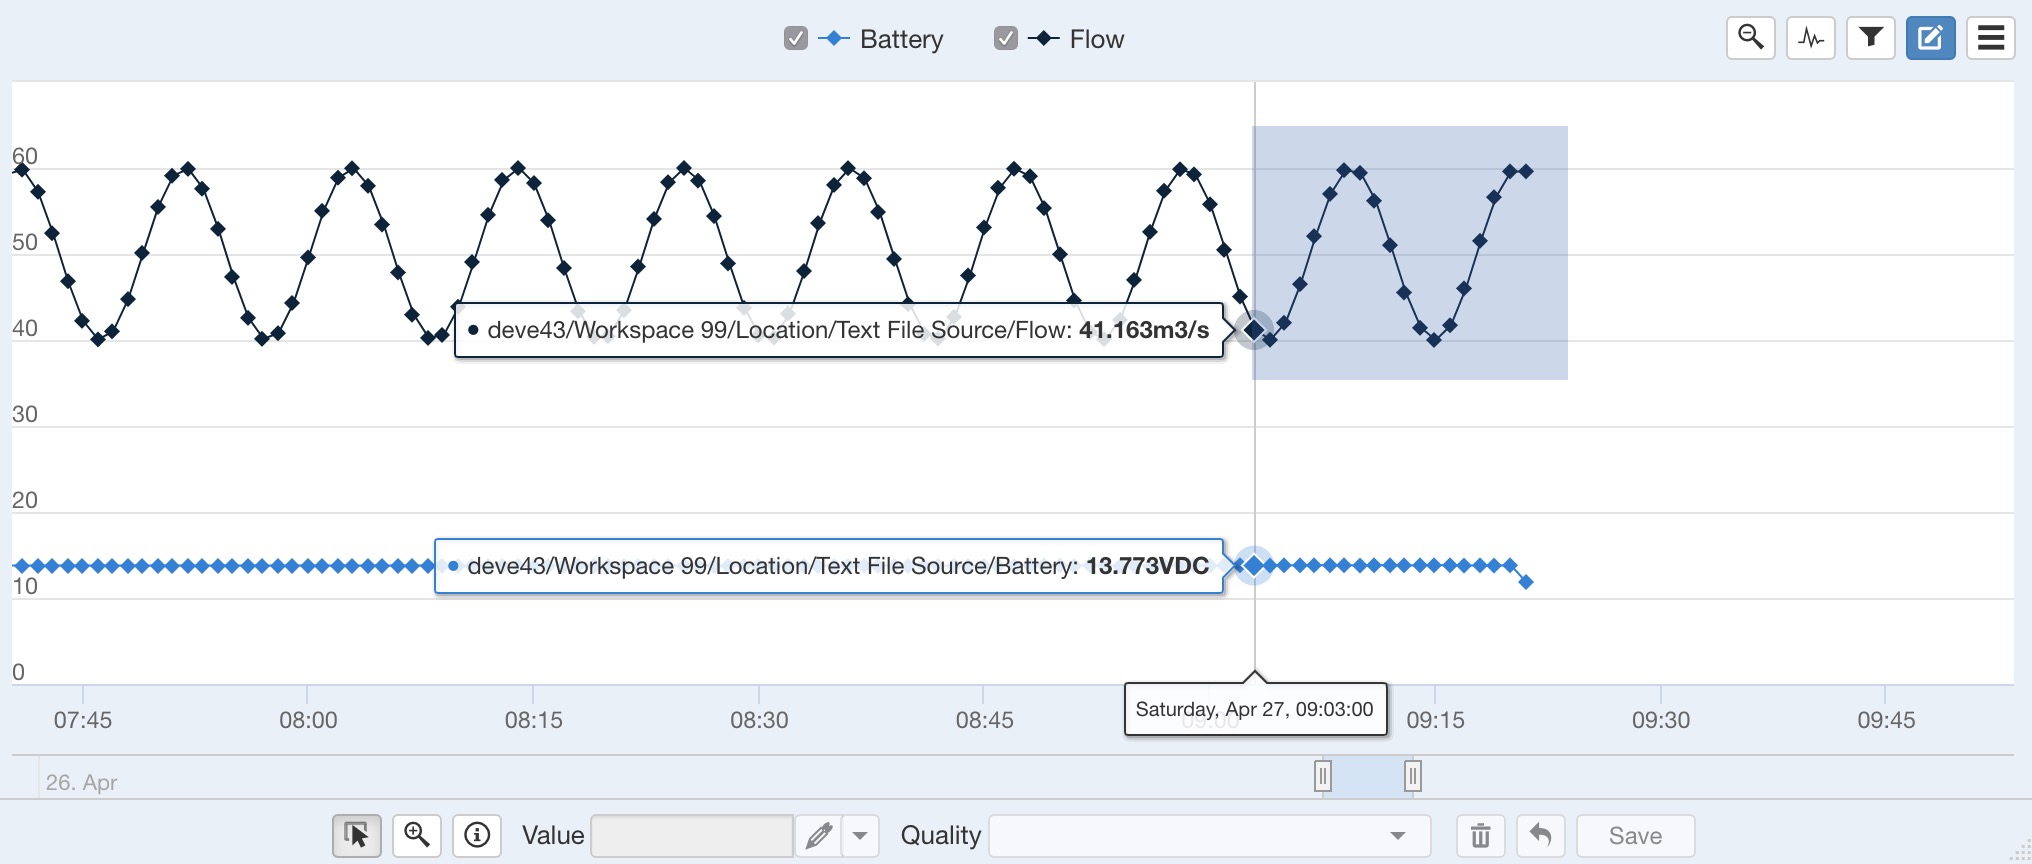
If you have assigned quality codes to the data, the associated quality code and color is displayed on hover.
Refer to working with charts for full details on chart interaction and functionality.
Toolbar
 Range selector
- Use the range selector to adjust the date range being shown on the chart.
 Zoom out
- After zooming in on a section of the chart the zoom out icon is displayed to reset the zoom range.
 Toggle parameter visibility
- Click the parameter icon to quickly toggle the visibility of all parameters. Click parameters in the chart legend to toggle the visibility of individual parameters.
 Toggle parameter editing
- After toggling data editing mode, the toggle parameter editing button is shown. Click this button to quickly select/deselect all editable parameters for editing.
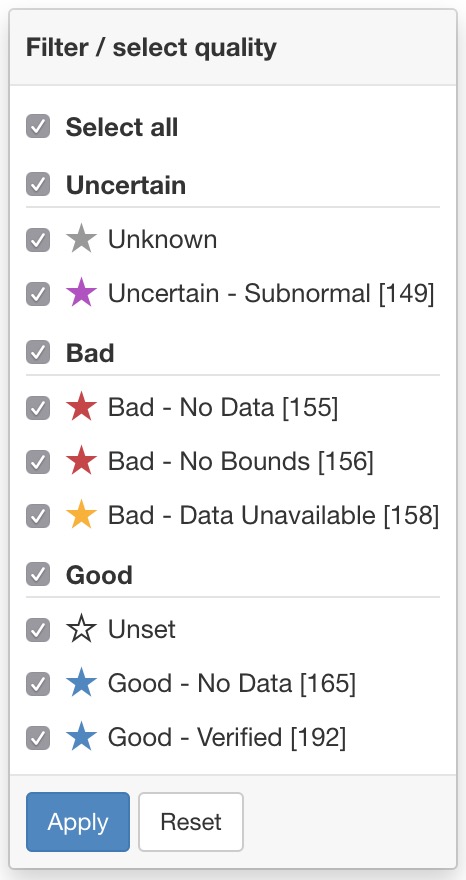
 Filters
Filter the dataset by selecting quality codes associated with the data points that you want to include. While editing data, apply filters to automatically select associated data points and temporarily hide filtered data points to prevent modification.
 Edit data
Use this feature to toggle into data editing mode and display the data editing toolbar.

Note
Users must have edit data or edit quality & annotations permission for the parameters they are trying to edit. Data editing is not available on STARTER accounts.
 Menu
MenuExport options can be found in the dropdown menu including:
 Print the chart.
 Save the chart as an image.
Parameter selection
The historic data dialog will only display the first 15 selected parameters by default. Use the Parameter selection panel accessible via the arrow on the right to refine your selection and change how the data should be displayed, including any aggregate calculations to be applied.
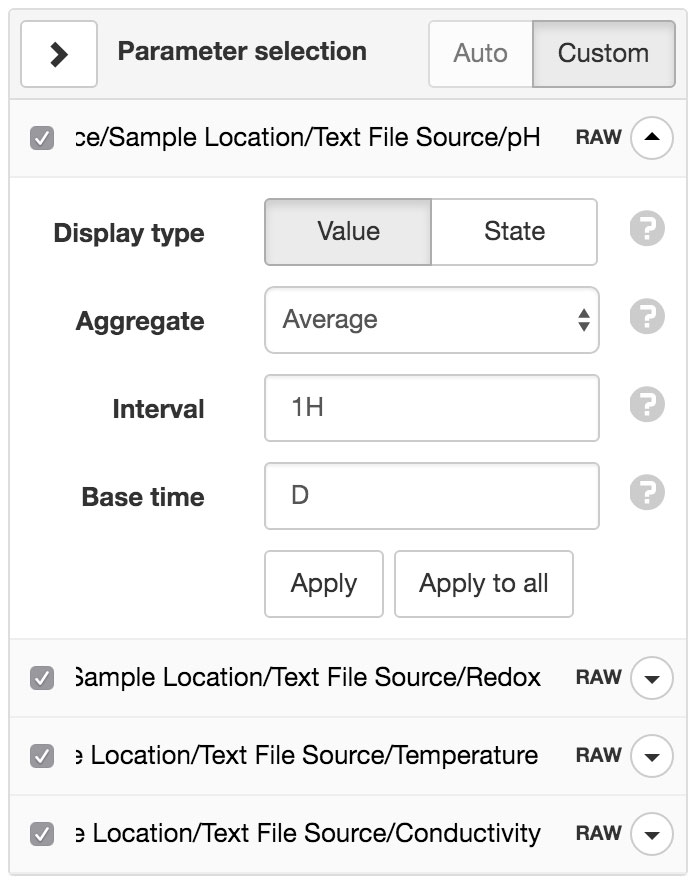
- Auto/Custom
Auto will use the default chart options for each parameter (as configured in parameter properties).
Custom allows you to specify custom display settings for each parameter. These settings are shared between table and exports for convenience.
- Display type
Value displays the parameter values.
State displays the state name associated with each value.
- Aggregate
- Aggregates provide a method to resample raw data over a specified period. See the list of available aggregates for full details. Select RAW to display the original raw data with no aggregation applied (Interval and Base time options will be hidden).
- Interval
- Specify the data range that is included for each calculated value. Example 30M will calculate a value for each 30 minute window of data.
- Base time
- Base time is used to determine the start of the aggregate calculations. Example D+9H will start the calculations at 9am (start of current day + 9 hours). See working with relative time for full details.
Note
Please be aware that displaying RAW data for a large time range may be time consuming to retrieve and process.
Data editing
The edit data button toggles into data editing mode.
Users must have edit data or edit quality & annotations permission for the parameters they are trying to edit. Data editing is not available on STARTER accounts.
Historic data is always edited as raw unprocessed records without any aggregate or transform options applied. Data editing can also be performed in tabular format.
Note
All saved changes are permanent. You should restrict access with the edit data user permission and audit changes via the events view. Limits apply when editing historic data.
The chart legend automatically updates with checkboxes next to parameters than can be edited. Only the first parameter is initially checked for editing. Check additional parameters to edit concurrently or click the Toggle parameter editing toolbar button to quickly select/deselect all editable parameters.
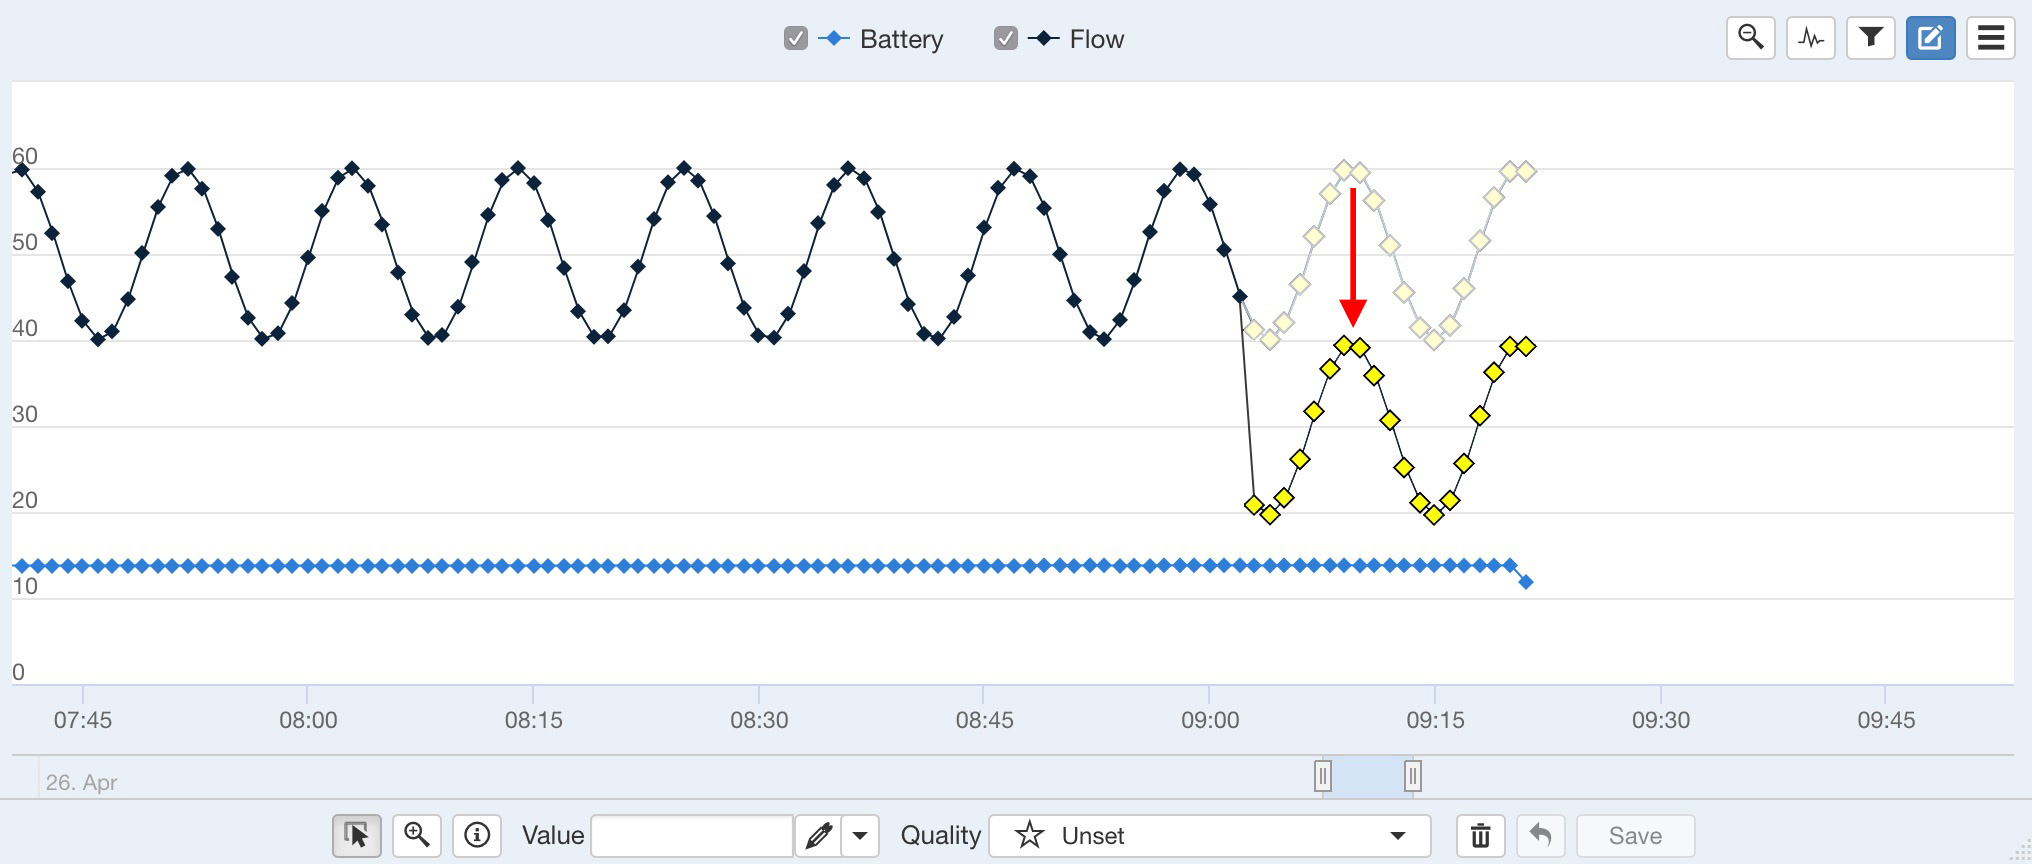
Selecting records
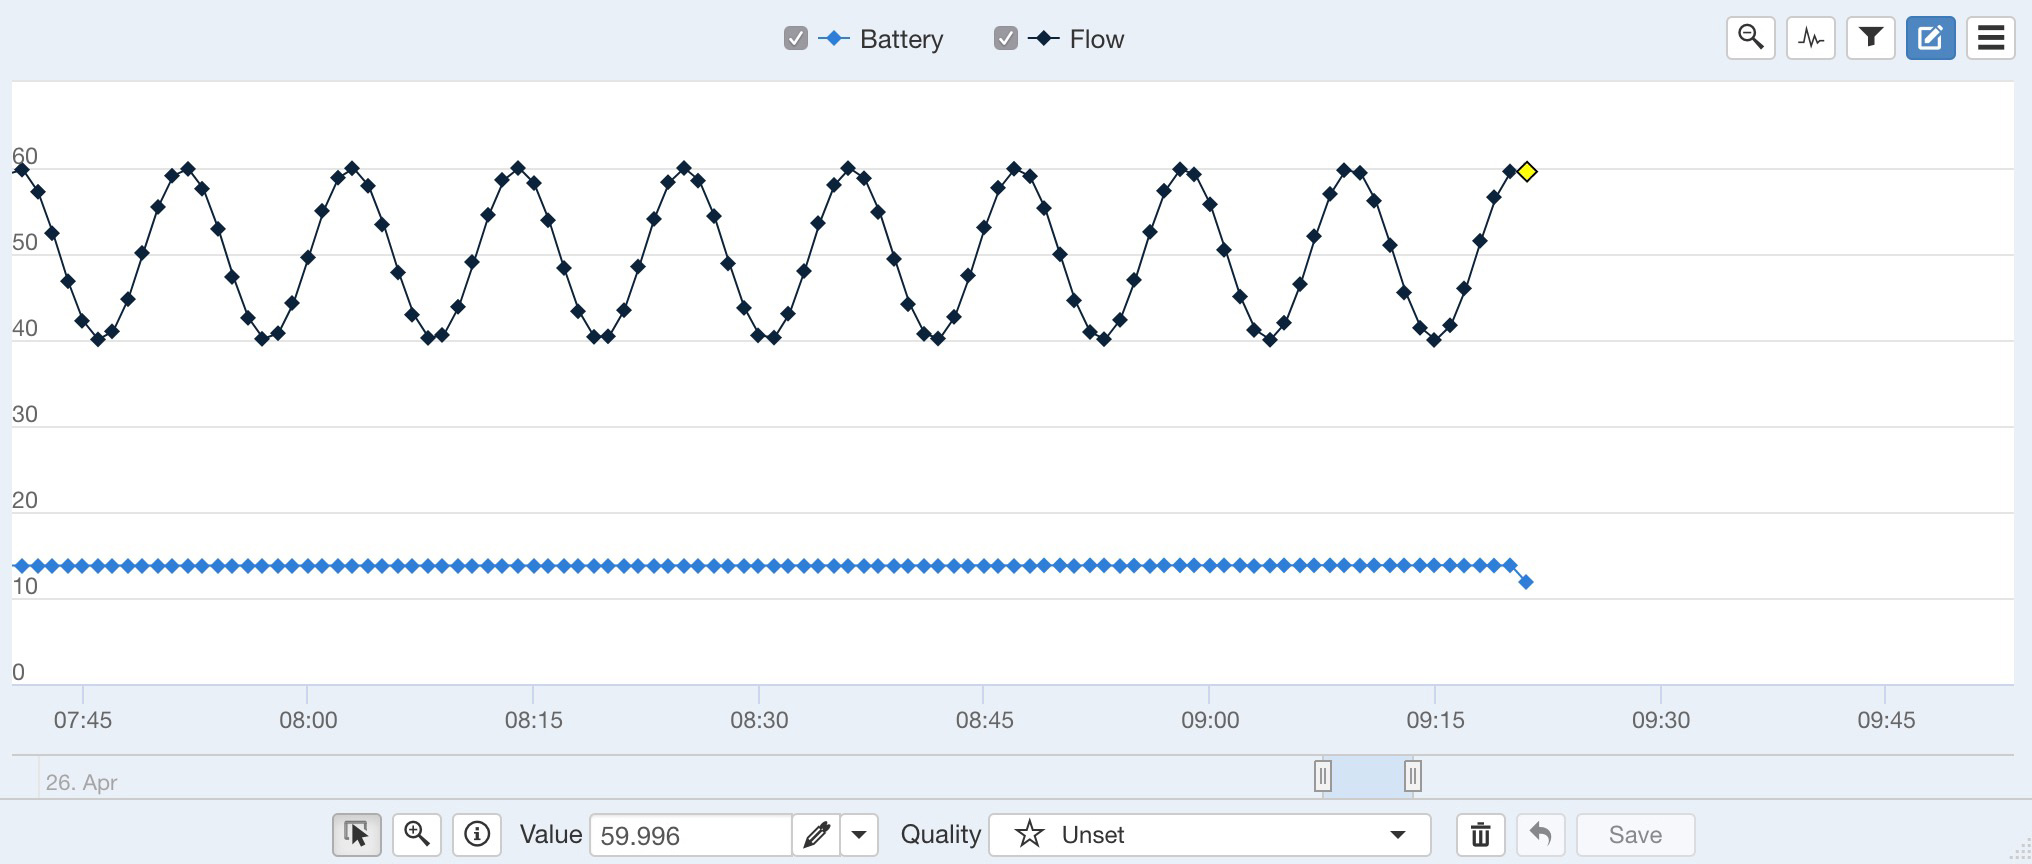
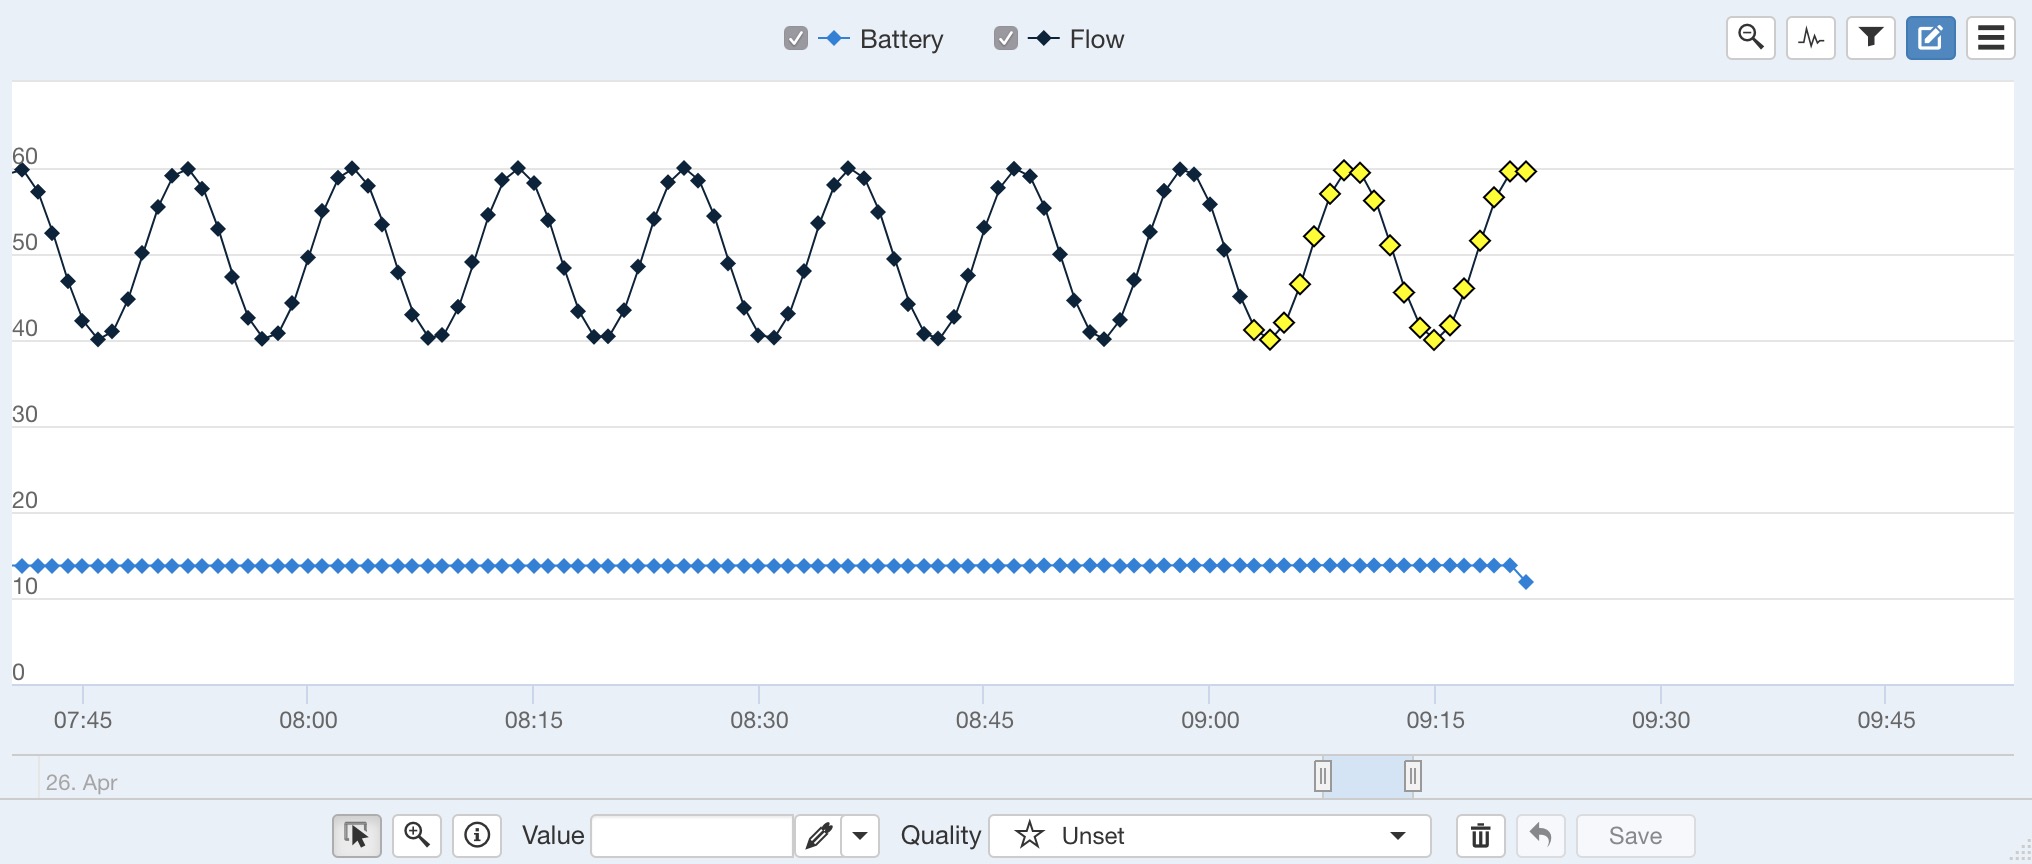
 Click a series data point marker to select an individual record.
Selected data points are displayed with a yellow marker when the user has both edit data and edit quality & annotations permissions for the parameter. Alternatively a dark grey marker will be displayed when the user only has edit quality & annotations permission.
While selecting records, hold the shift key to add or alt key to remove from the current selection.
Click and drag over the chart to quickly select multiple records.
Apply filters to select records based on quality.
Editing records
An individual record can include value, quality and annotation.
Right-click on an editable data point or selection of data points to quickly perform operations via the chart context-menu.
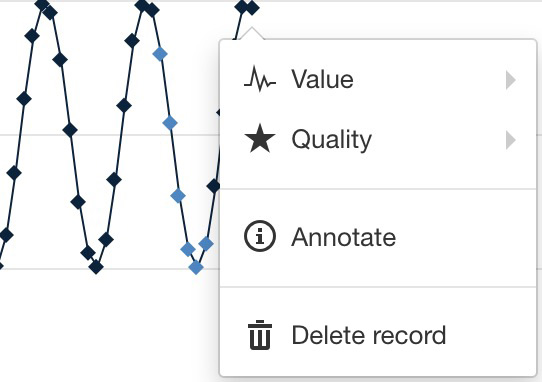
Set value
 Enter a new value to be assigned to the selected data point(s) and press enter or click the set value icon.
Change the functionality of the value input by selecting a value operation from the dropdown menu.
Enter a new value to be assigned to the selected data point(s) and press enter or click the set value icon.
Change the functionality of the value input by selecting a value operation from the dropdown menu.
Set value assigns a specific value to selected records.
Offset by value adds a value to to selected records.
Scale by value multiplies selected records by a specific value.
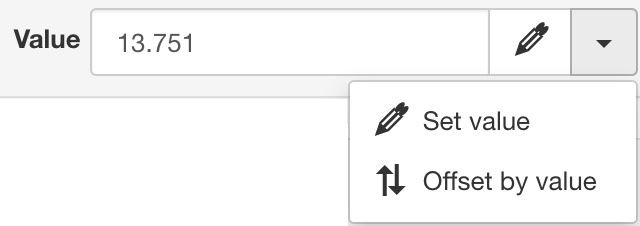
You can also use set value to unset a value (leave blank) which will result in historic charts showing a gap in the series when displaying RAW historic data.
Charts support drag and drop of selected data point(s) to free-hand edit record values.
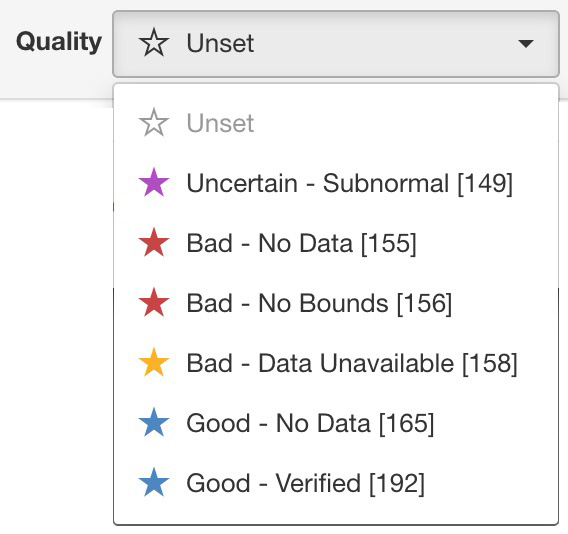
Set quality
 Select a quality to be assigned to the selected data point(s) from the dropdown quality menu.
You can only assign quality codes that have been pre-configured in account settings.
Select a quality to be assigned to the selected data point(s) from the dropdown quality menu.
You can only assign quality codes that have been pre-configured in account settings.
Set annotation
 To set an annotation for a single record either change to annotate mode from the edit toolbar and click on a data point
or right-click on a data point and select annotate from the context menu.
To set an annotation for a single record either change to annotate mode from the edit toolbar and click on a data point
or right-click on a data point and select annotate from the context menu.
Annotations can be set on multiple data points at once by first selecting the data point then selecting annotate from the context menu.
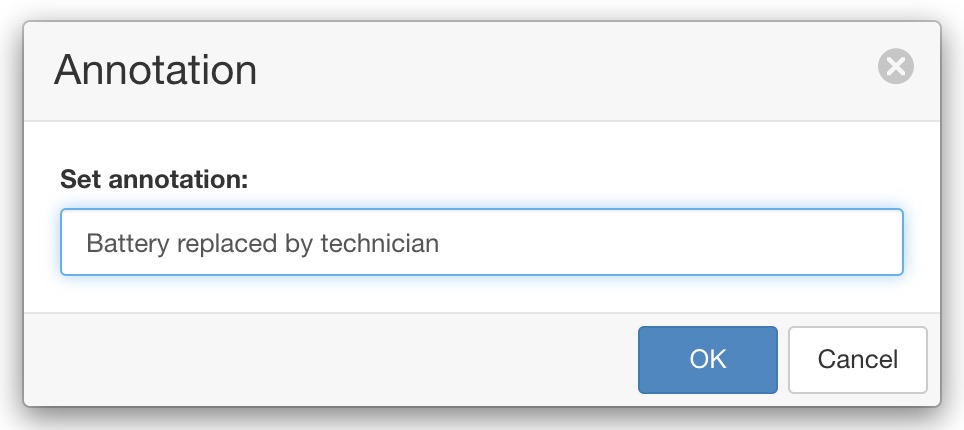
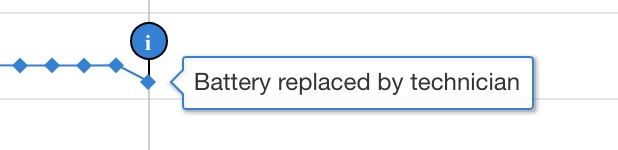
Hover or click the annotation icon to display the annotation text.
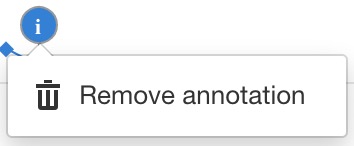
To remove an annotation clear the text in the annotation entry dialog or right-click on the annotation icon and select remove annotation from the context menu.
Delete record
 The delete operation permanently removes the selected records from the historic dataset.
Undo last edit
 The undo command reverts the last edit operation. You can continue to undo all edit operations since the last save.
Save changes
Save all changes to the modified records.
Note
All saved changes are permanent. You should restrict access with the edit data user permission and audit changes via the events view.