Parameter
 Parameters are managed by and contained within Data Sources. Parameters store the individual timeseries acquired by its Data Source. There are a few different types of parameters but essentially they support Monitoring or Controlling of values.
Types of Parameters
- Number Parameter
- Number Parameters store historic time series data in numeric format. By default they display the current or historic value(s). Parameters are managed by and are always contained in Data Sources.
 Number Parameter (State variation)
- Number Parameters can also be set to display the current or historic state rather than value. This is useful for Boolean or Discrete state data.
 Number Control Parameter
- Number Control Parameters are similar to Number Parameters however the value can be controlled by the user. Historic data represents the user control operations.
 Number Control Parameter (State variation)
- Number Control Parameters can also be set to display the current or historic state(s)
 Number Process Parameter
- Number Process Parameters are similar to Number Parameters however the value is generated by a process.
 Number Process Parameter (State variation)
- Number Process Parameters can also be set to display the current or historic state rather than value. This is useful for Boolean or Discrete state data.
 Rating Parameter
- Rating Parameters are similar to Number Parameters however the value is generated by a rating.
 Rating Parameter (State variation)
- Rating Parameters can also be set to display the current or historic state rather than value. This is useful for Boolean or Discrete state data.
 Text Parameter
- Text Parameters store historic time series data in text format. They are useful when trying to capture events from log files or text-based data files.
 Text Control Parameter
- Text Control Parameters are similar to Text Parameters however the value can be controlled by the user. Historic data represents the user control operations.
 Text Process Parameter
- Text Process Parameters are similar to Text Parameters however the value is generated by a process.
 Time Parameter
- Time Parameters store historic time series data as timestamps. Note: Time Parameters can not be displayed on charts.
 Time Control Parameter
- Time Control Parameters are similar to Time Parameters however the value can be controlled by the user. Historic data represents the user control operations. Note: Time Parameters can not be displayed on charts.
 Time Process Parameter
- Time Process Parameters are similar to Time Parameters however the value is generated by a process.
Properties
 Configure properties via the Workspaces Tree context menu or List View properties icon. Requires configure permission.
Note
Available options will vary based on Parameter type.
General
The general section allows you to specifiy display settings for Number and Time Parameters.
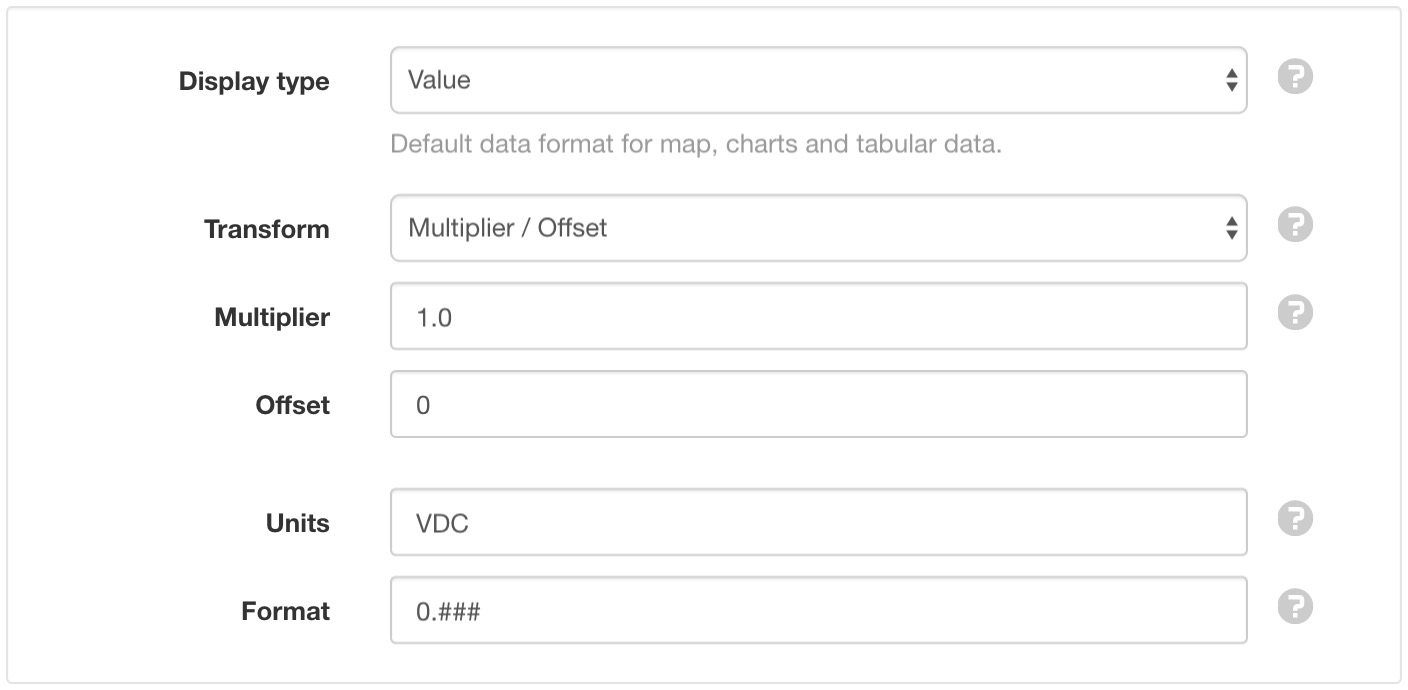
- Display type
Select how this parameter should be displayed by default:
Value is the default display type for analog data.
State can be used for digital or discrete data and displays the state associated with the value (rather than the value).
- Transform
Optionally apply a Multiplier/Offset or Equation to the stored historic data for display, notifications and alarms.
Multiplier is applied to raw data for state evaluation and display.
Offset is a value applied to raw data for state evaluation and display. Note: Multiplier is always applied before offset.
Equation can be used to apply an advanced mathematical transformation of the value.
- Units
- The units (suffix) to be displayed with the value or state.
- Format
Specify how the value should be formatted for display.
Number Parameters use this setting to set how many decimal places should be shown (leave empty to display the value with all included decimal places). 0 will always display a digit. # will only display a digit if it exists.
Time Parameters use this setting to determine the formatting of the timestamp (leave empty to display timestamps in your default user time format). Select a preset format from the drop down list or specify a custom format using time format tokens.
- Quality Alarm
- See Alarms and Notifications.
States
States allow you to define unlimited numbers of Ranges or Discrete thresholds that uniquely describe the current value of the parameter. Each state can optionally be configured to raise an alarm and/or send notifications.
Note
Number Parameters can use either Range or Discrete states. Text Parameters are limited to Discrete states only.
Click the Edit button to show and modify the configuration for each state. Use the Add state button to create a new state. States can be removed via the dropdown menu (accessible by clicking the menu button on the top-right corner of the state item).
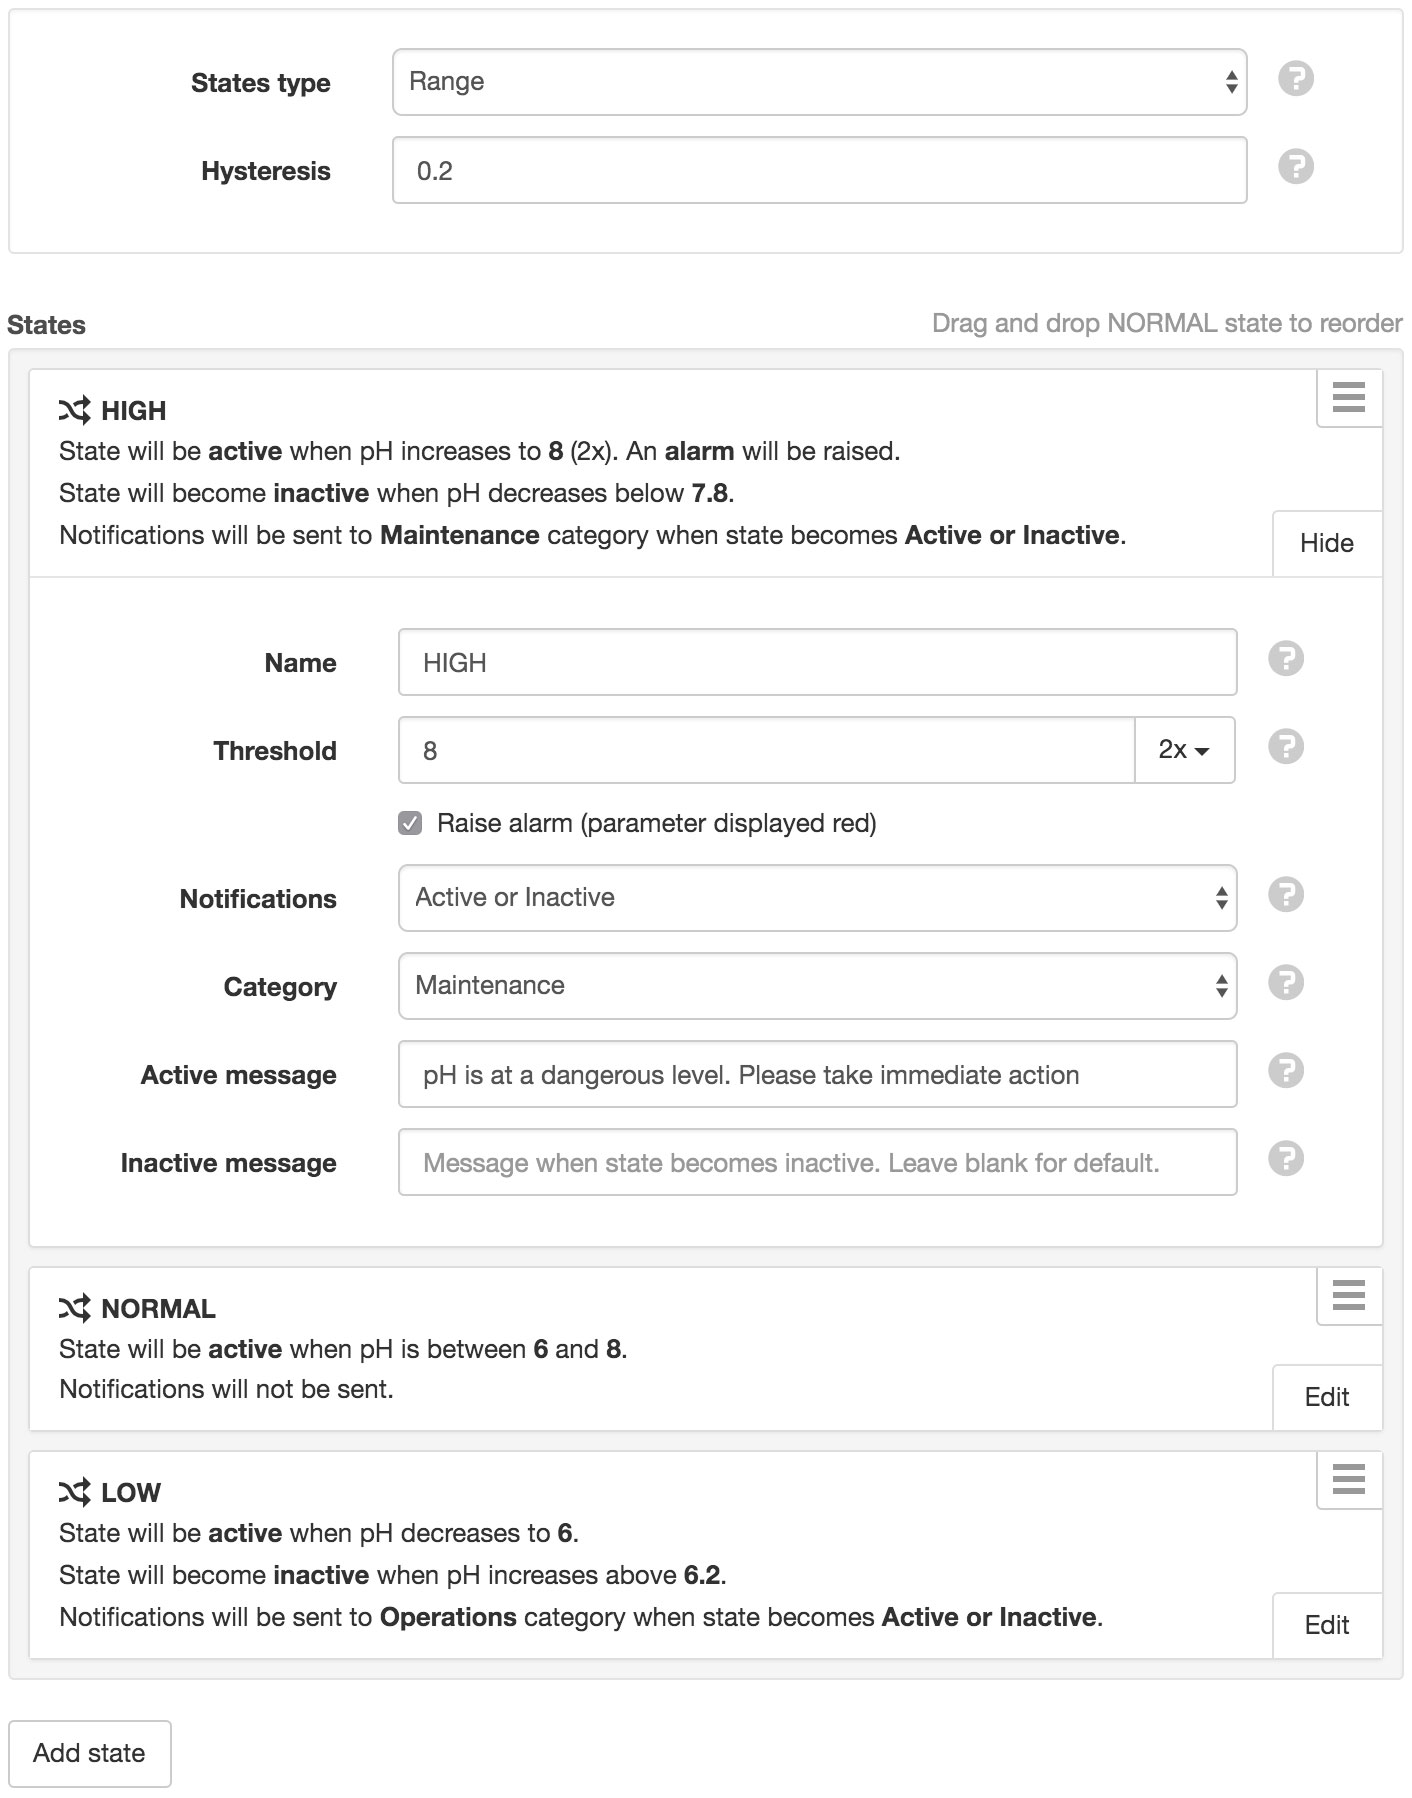
Range States
Drag and drop the NORMAL state in the list to change its order. The NORMAL state must always exist and can not be removed. Position states above or below the NORMAL state to capture higher or lower than normal values respectively.
Discrete States
Drag and drop states in the list to change their display/evaluation order.
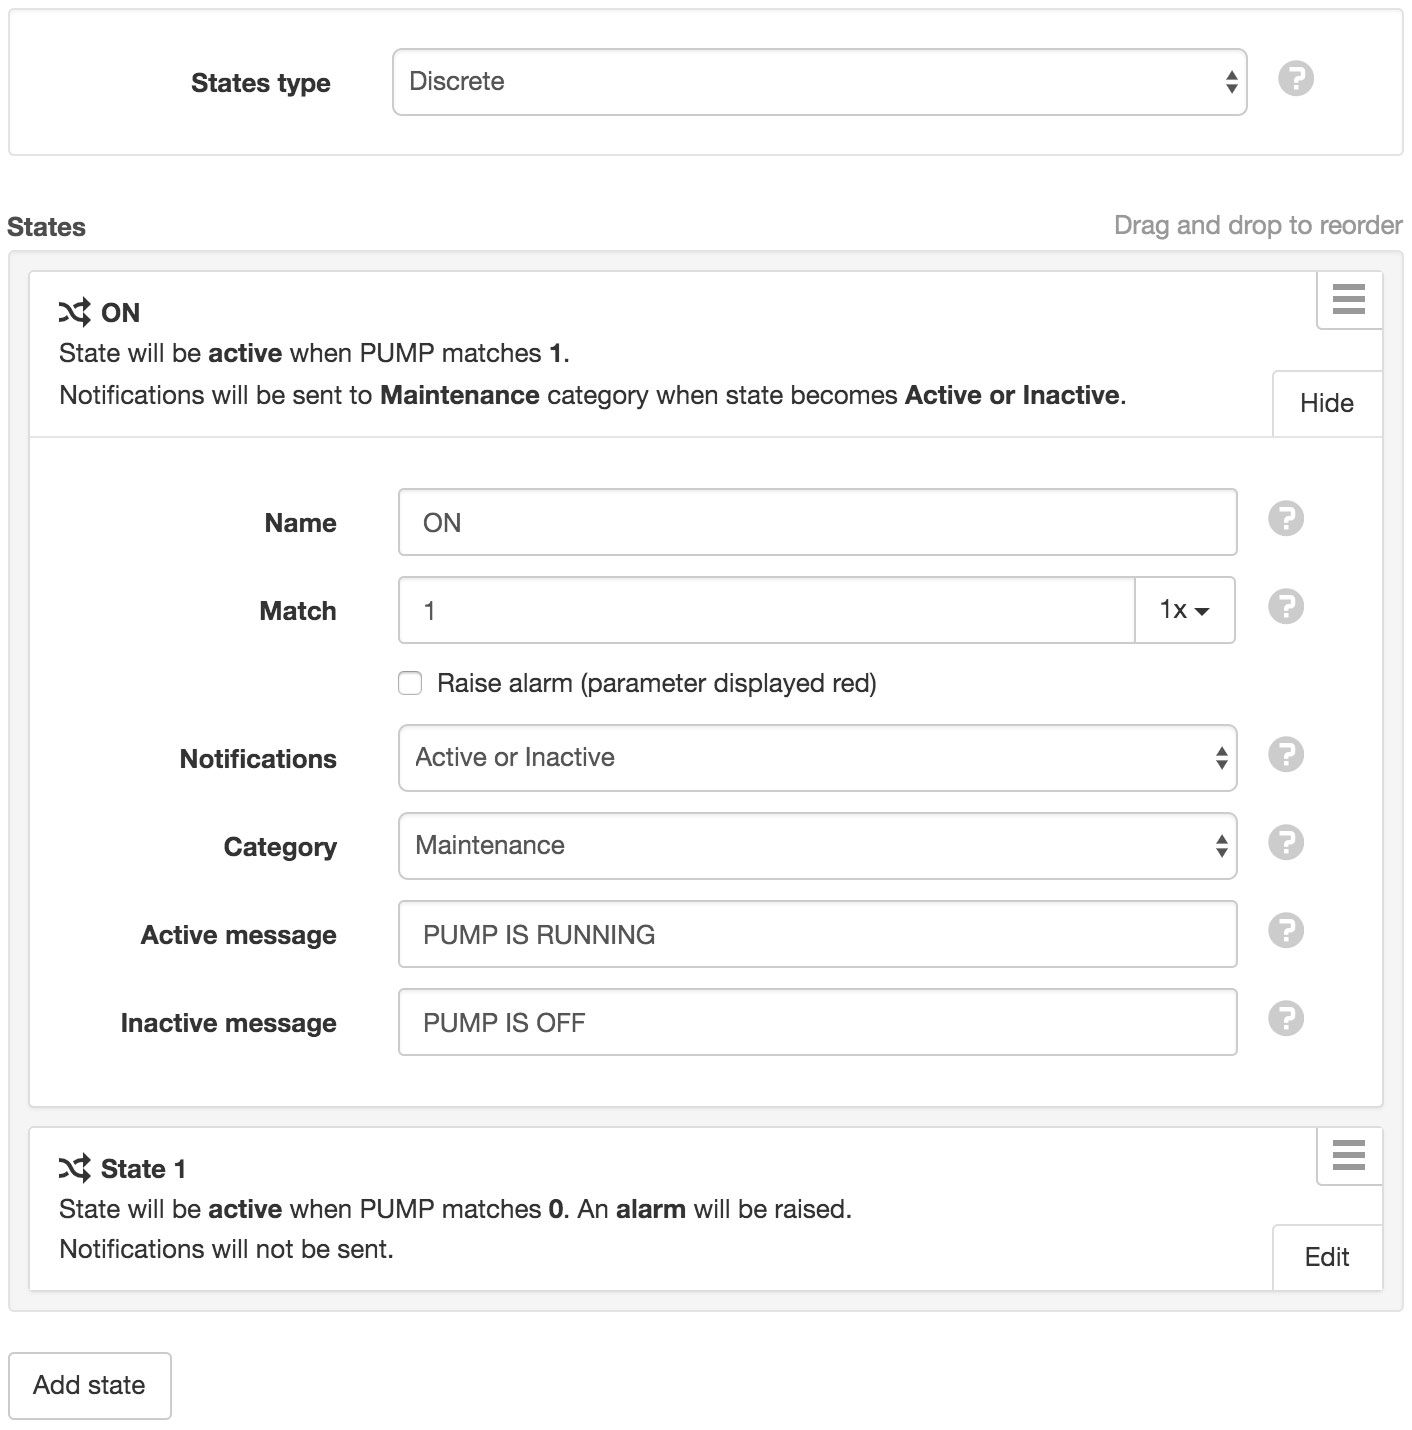
- States type
Select the type of States most suitable for your data.
Range is the default option for most analog data and allows you to define a State that covers a range of values. eg. 1-10 = LOW
Discrete is most commonly used with digital data where a State represents a specific (or matching) value. eg. 0 = OFF, 1 = ON
- Hysteresis
- Hysteresis is the amount the parameter value is required to decrease below the state threshold (states above NORMAL) or increase above the state threshold (states below NORMAL) for the active state to become inactive as it revert towards NORMAL. Hysteresis only applies to Range States and must be a number greater than or equal to 0.
- Name
- Assign a unique name for each State. The NORMAL State (Range States) can not be renamed or removed.
- Threshold
States positioned above NORMAL will be active when the parameter value increases to this threshold. States positioned below NORMAL will be active when the parameter value decreases to this threshold. Optionally use the dropdown menu to specify the minimum number of repeat values at or beyond threshold required to trigger this state. Default 1x.
Applies to Range States only.
- Match
- Number Parameters
- Specify the numeric value to match.
- Text Parameters
- Specify text contained within the value, or alternatively a regular expression which must begin and end with forward-slash, e.g.
/^(?!message).*$/
Optionally use the dropdown menu to specify the minimum number of matching repeat values required to trigger this state. Default 1x.
Applies to Discrete States only.
- Raise alarm
- Check this option to raise an alarm when this state becomes active.
- Quality
- Optionally select a quality code to be applied to newly acquired data that matches this state.
- Notifications
Select when notifications should be sent.
Active or Inactive will send notifications when the state becomes active or inactive.
Active will only send notifications when the state becomes active.
Inactive will only send notifications when the state becomes inactive.
Never will not send notifications.
- Category
- Select the category of subscribed users that will receive notifications for this State.
- Active message
- Enter a custom message to send when the state becomes active (may contain expressions). Leave blank for a default message that includes the state name, value and timestamp.
- Inactive message
- Enter a custom message to send when the state becomes inactive (may contain expressions). Leave blank for a default message that includes the state name, value and timestamp.
Chart
Charts section allows you to configure the display style and formatting of the parameter when displayed in the Charts View or shown on the adhoc Historic Chart.
Data
Select the data and processing to be used.
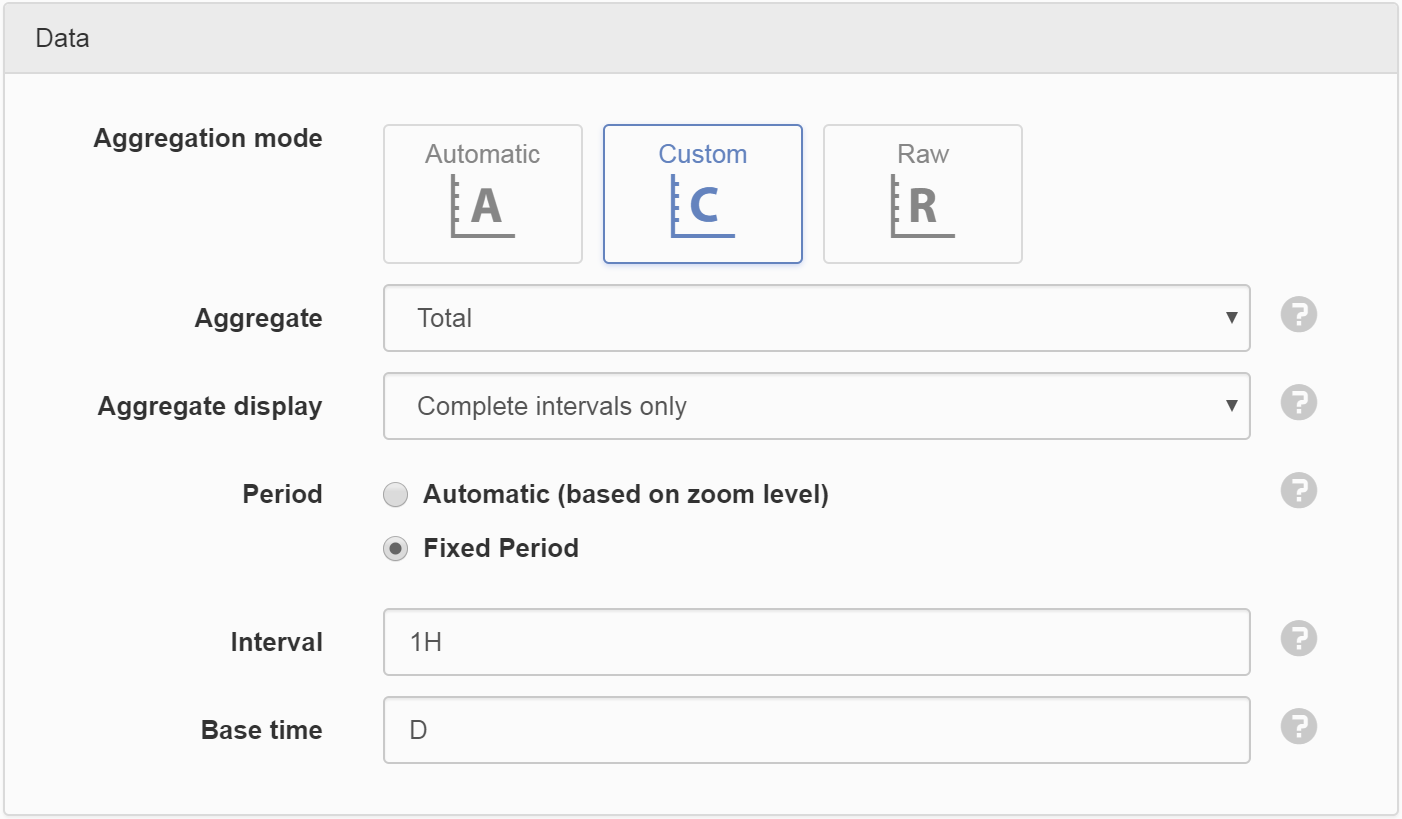
- Aggregation mode
Automatic
Automatic is the recommended option for fast loading charts and uses Interpolated (or Start where Display type is State) aggregate and automatic period selection based on zoom level.Custom
Custom allows you to specify exactly how data should be aggregated for display on the charts.
- Aggregate
- Aggregates provide a method to resample raw data over a specified period. See the list of available aggregates for full details. Select RAW to display the original raw data with no aggregation applied (Interval and Base time options will be hidden).
- Aggregate display
- Determines if aggregated data will be show only after intervals are complete, or be shown during an aggregation interval when only partial data is available.
- Period
- Automatic will change the period of the aggregate calculation based on the zoom level of the chart. Fixed Period lets you define a fixed Interval and Base time that will be applied regardless of the zoom level.
- Interval
- Specify the data range that is included for each calculated value. Example 30M will calculate a value for each 30 minute window of data.
- Base time
- Base time is used to determine the start of the aggregate calculations. Example D+9H will start the calculations at 9am (start of current day + 9 hours). See working with relative time for full details.
Raw
Raw does not perform any aggregation of data. This option should ONLY be used where you know the period to be displayed does not contain more than a thousand data points. Displaying high resolution raw data can impact on chart performance and in some cases may cause the chart to fail loading or have adverse affects on your web browser.- Baseline type (Custom Historic Charts only)
Absolute
Data point values are not modified.Relative
The first data point value in the requested time range is subtracted from all subsequent data point values.
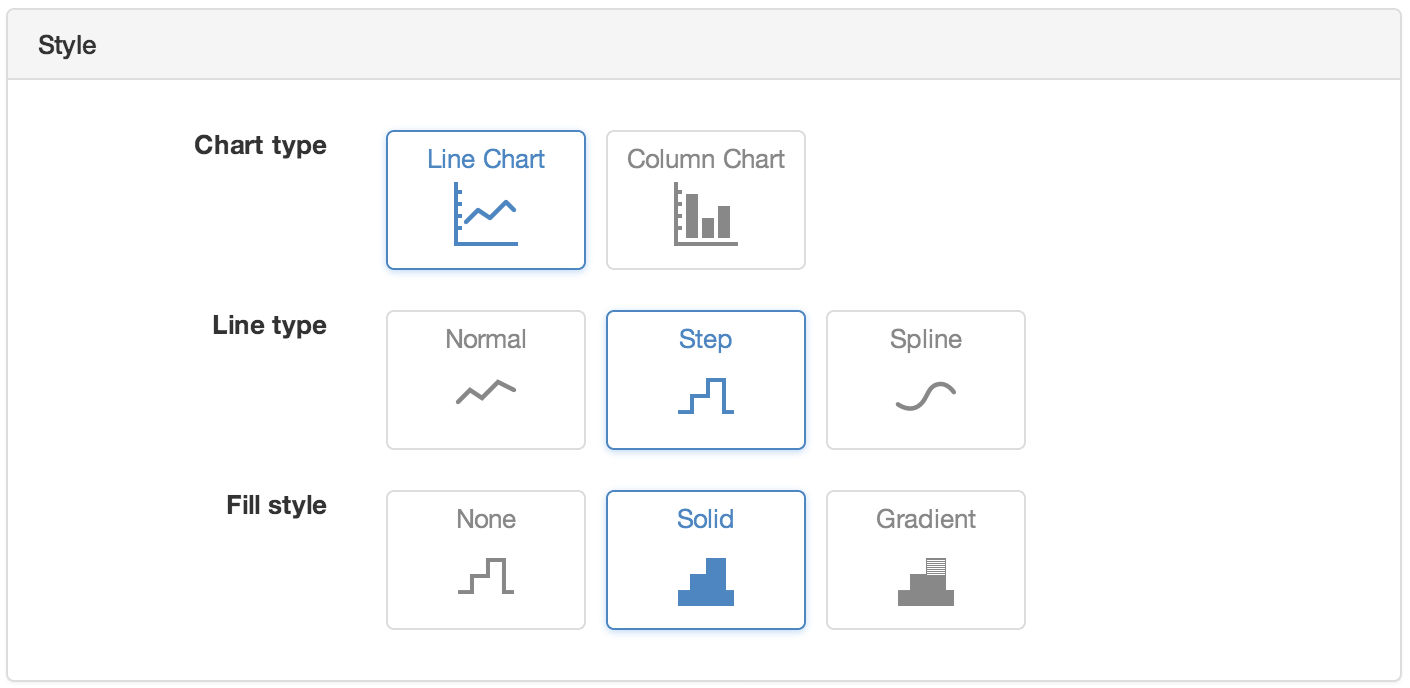
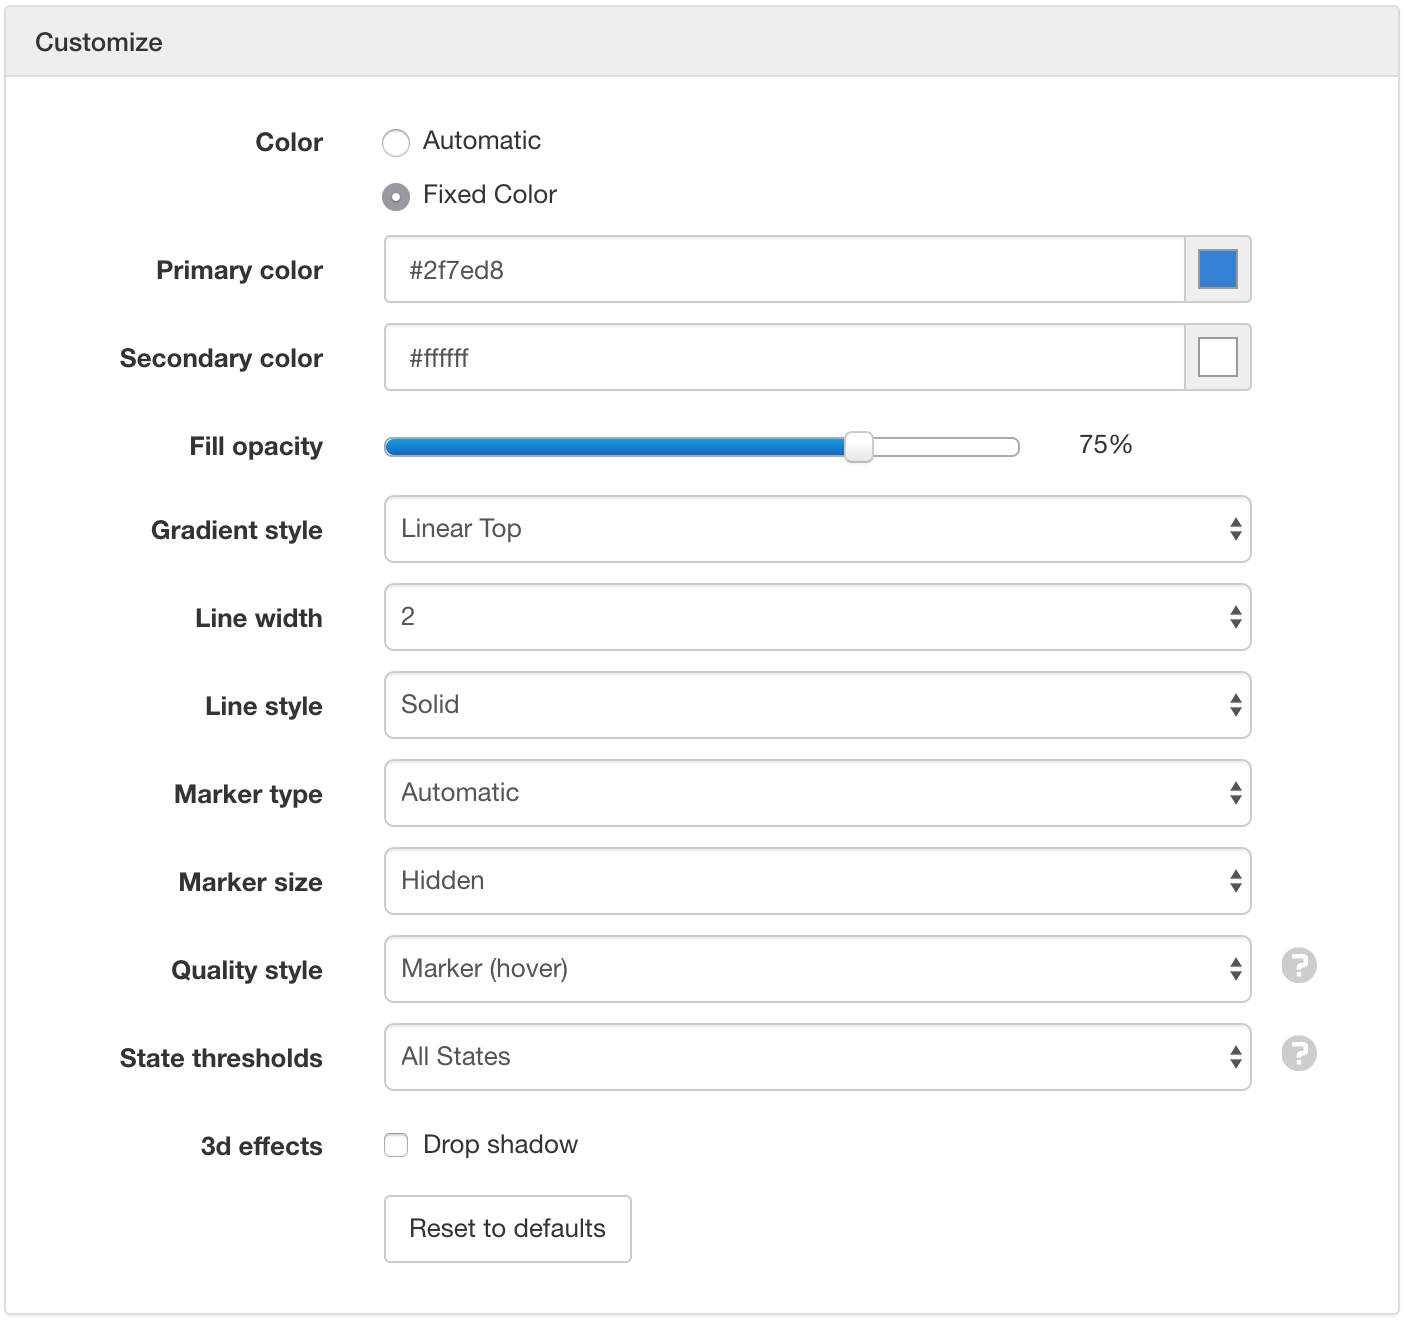
Customize
Select customization options for chart appearance.
Settings of Interest
- Color
- Select Fixed Color to specify a color(s) to use for this parameter or Automatic to have it auto-assigned. If the Chart Fill Style is set to Gradient then you can also set a Secondary color.
- Line width
- Set to Hidden to hide the line completely. If the Fill Style is set to NONE then you should ensure the Marker size is set.
- Marker position
- Step charts can be displayed with the marker Left, Center or Right of the step. Left is the default option.
- Column placement
- Column Placement applies to Column Charts only and determine where the columns should be positioned in relation to the x-axis. Options include On Ticks and Between Ticks.
- Marker size
- Data point markers are hidden by default (shown on hover), but can be set to always display by specifying a size between 1-6 (small-large).
- Quality style
- Select how quality colors are displayed on the chart. By default chart markers will only show quality color on hover.
- State thresholds
Select which State thresholds should be displayed on the chart:
- Hidden
- Hide all State thresholds.
- All States
- Show all State thresholds.
- Alarm States Only
- Show alarm State thresholds only.
- Non-Alarm States Only
- Show non-alarm State thresholds only.
- User Notification States Only
- Show thresholds for States that have a category assigned that the viewing user is subscribed to receive notifications from.
Rating
Rating parameters use an Input parameter and one or more ratings to caculate its data.
Rating tables should have multiple rows specifying an input lookup value and corresponding result value. Values that fall between each input lookup will be derived by linear interpolation.
Rating equations allow multiple coefficients to be defined which are used to calculate a value using a polynomial equation.
Multiple ratings can be added, with the start time used to determine the data range each rating will apply.
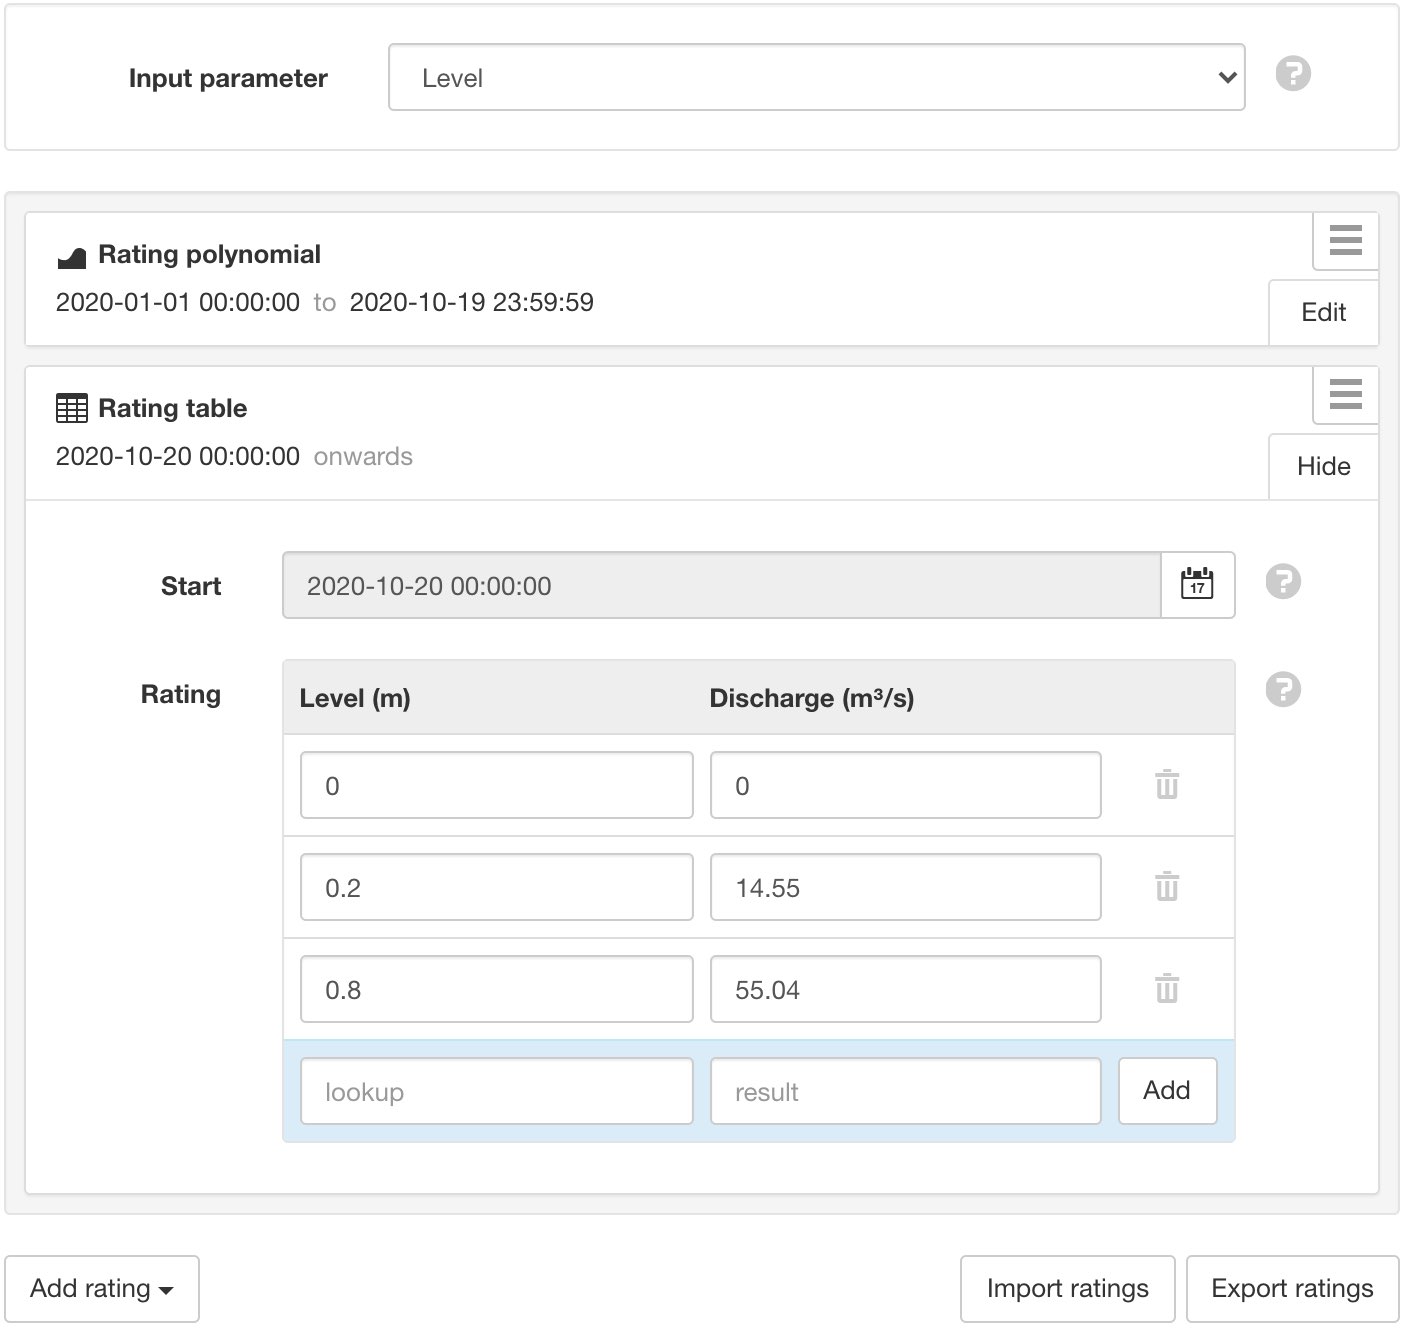
Ratings can be imported and exported using the fixed ratings CSV format.
Note
Only Number parameters within the same Workspace (or Template) can be used as the Input parameter.
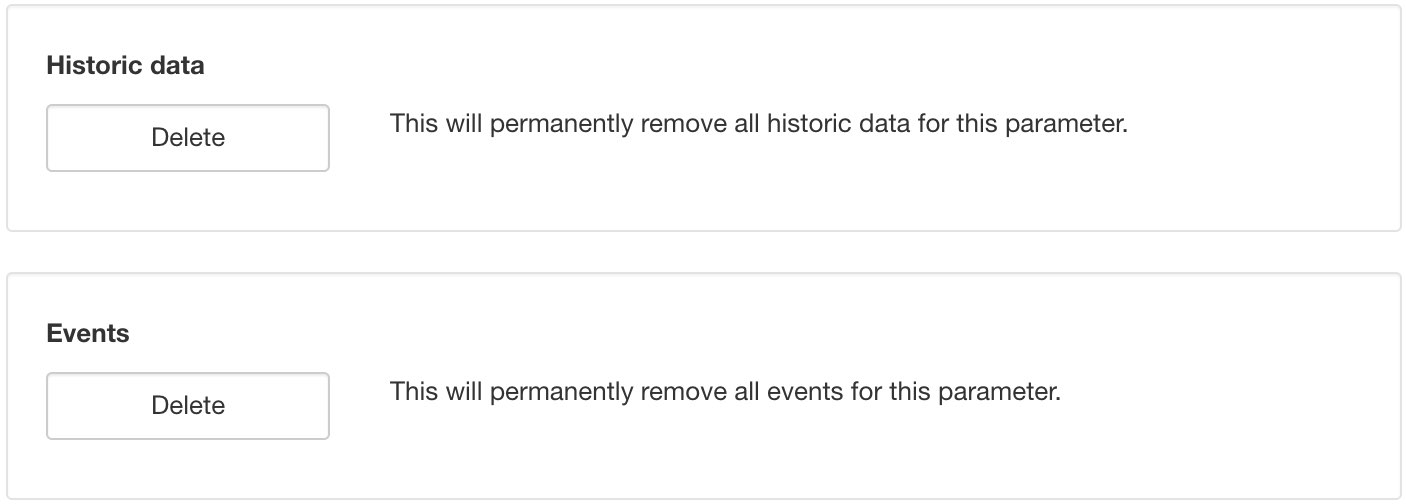
Historic
Click the Delete buttons and save to permanently remove all historic data or events for this Parameter.
Control
The control section allows you to configure control options for Control Parameters.
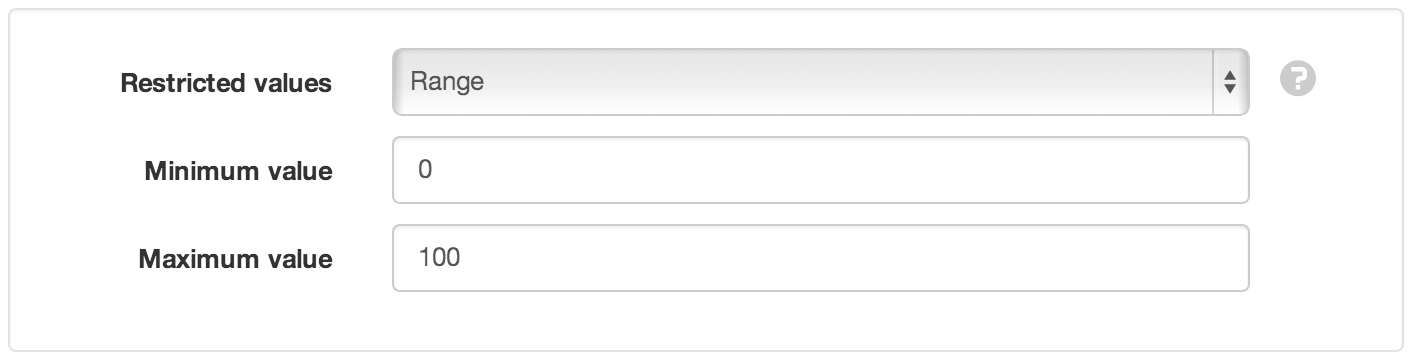
- Restricted values
Select what values are acceptable for control operations:
None
None does not restrict the control value. User can enter any value of the same type as the parameter. eg. Number, Text, Time.Range
Range restricts Number Parameter control values with a minimum and maximum value.States
States restricts control values to the configured state threshold/match values. eg. ON / OFF.- Control Alarm
- See Alarms and Notifications.
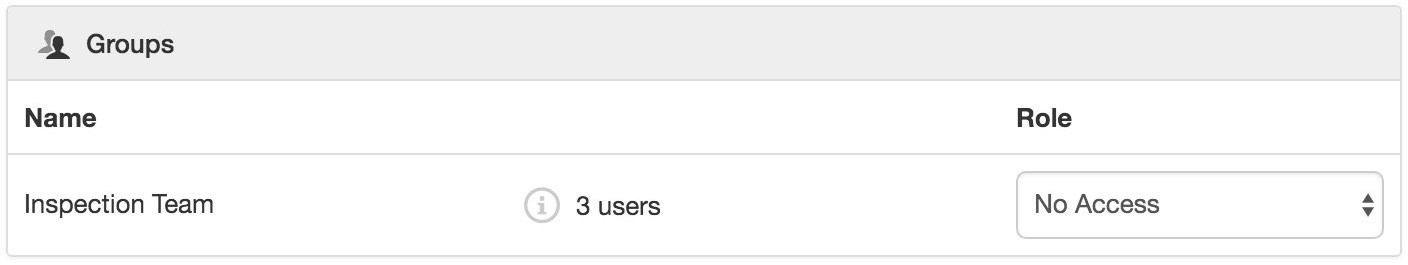
Security
The Security section displays a list of all users and groups that have access to the Node. Users with security permission can restrict user and group access to the node and its descendants by assign the No Access role.
New users and groups must be added via the Workspace Security section.
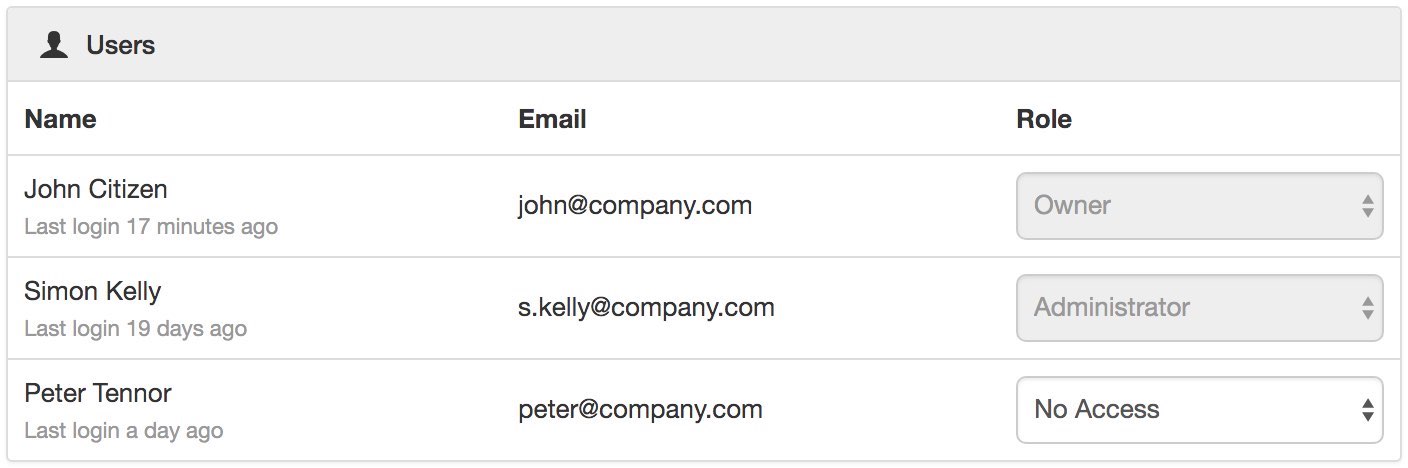
Note
The Account Owner, Administrators or Workspace users/groups that have been assigned a Workspace role with the configure permission can not be assigned the No Access role.
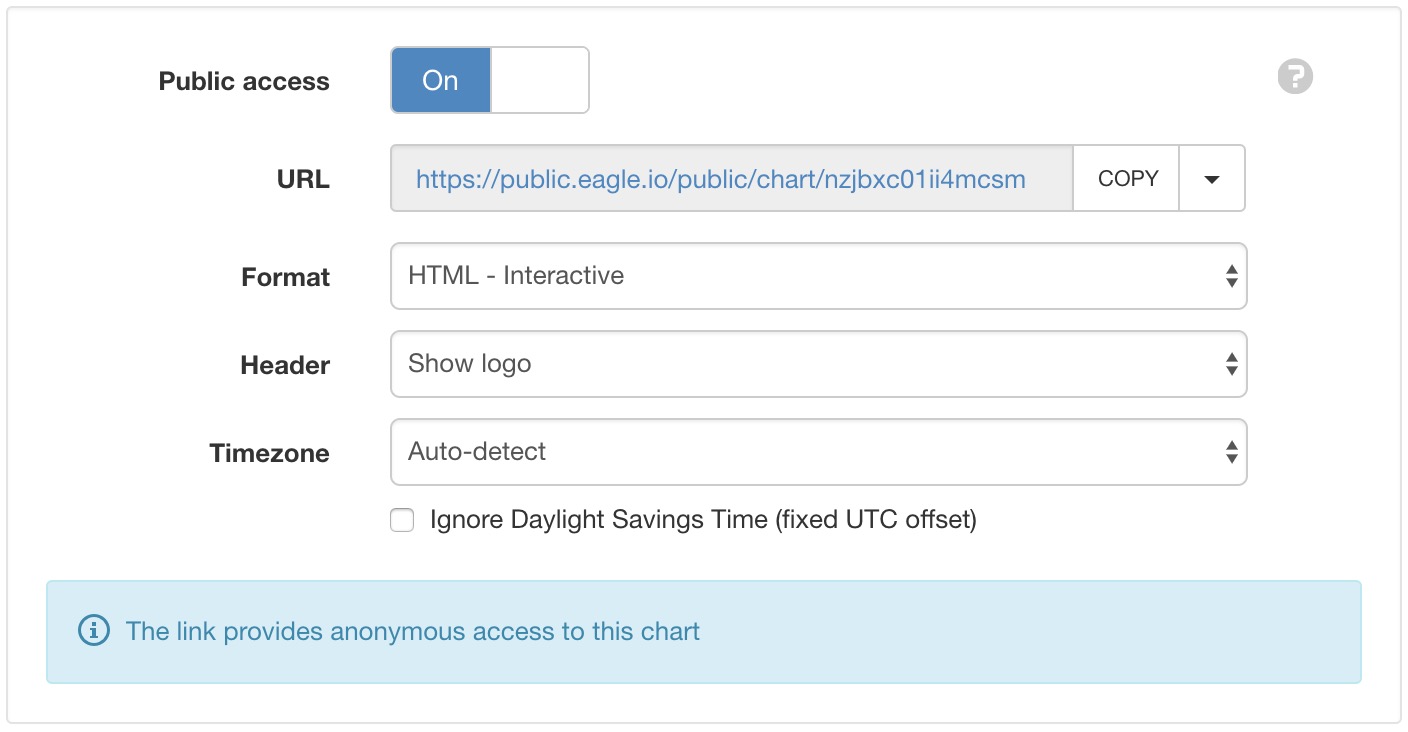
Public access
Enabling public access allows anyone to view the node (attachment, chart, dash, report or historic data) using the generated URL.
You can also embed charts and dashboards into your own website with basic HTML. Select Copy embed HTML from the URL dropdown menu for a generic code snippet (you will need to paste this in to your website). You can also revoke and replace the automatically assigned URL by selecting the Generate new URL option in the menu.
Use the available options to customize the URL based on your display preferences. These options are transient and you can use multiple variations of the URL at the same time.
Note
This feature is not included in Starter accounts.