Chart
 Use the Chart View for reviewing your timeseries data as highly interactive charts. Choose to group data on charts by Location or Parameter type. Charts are displayed using the settings configured for each individual parameter. See Parameter configuration for full details.
Note
The view displays content based on the Selected Node in the Workspaces Tree. Use filters to quickly target specific parameters or review alarms.
Subviews
Locations
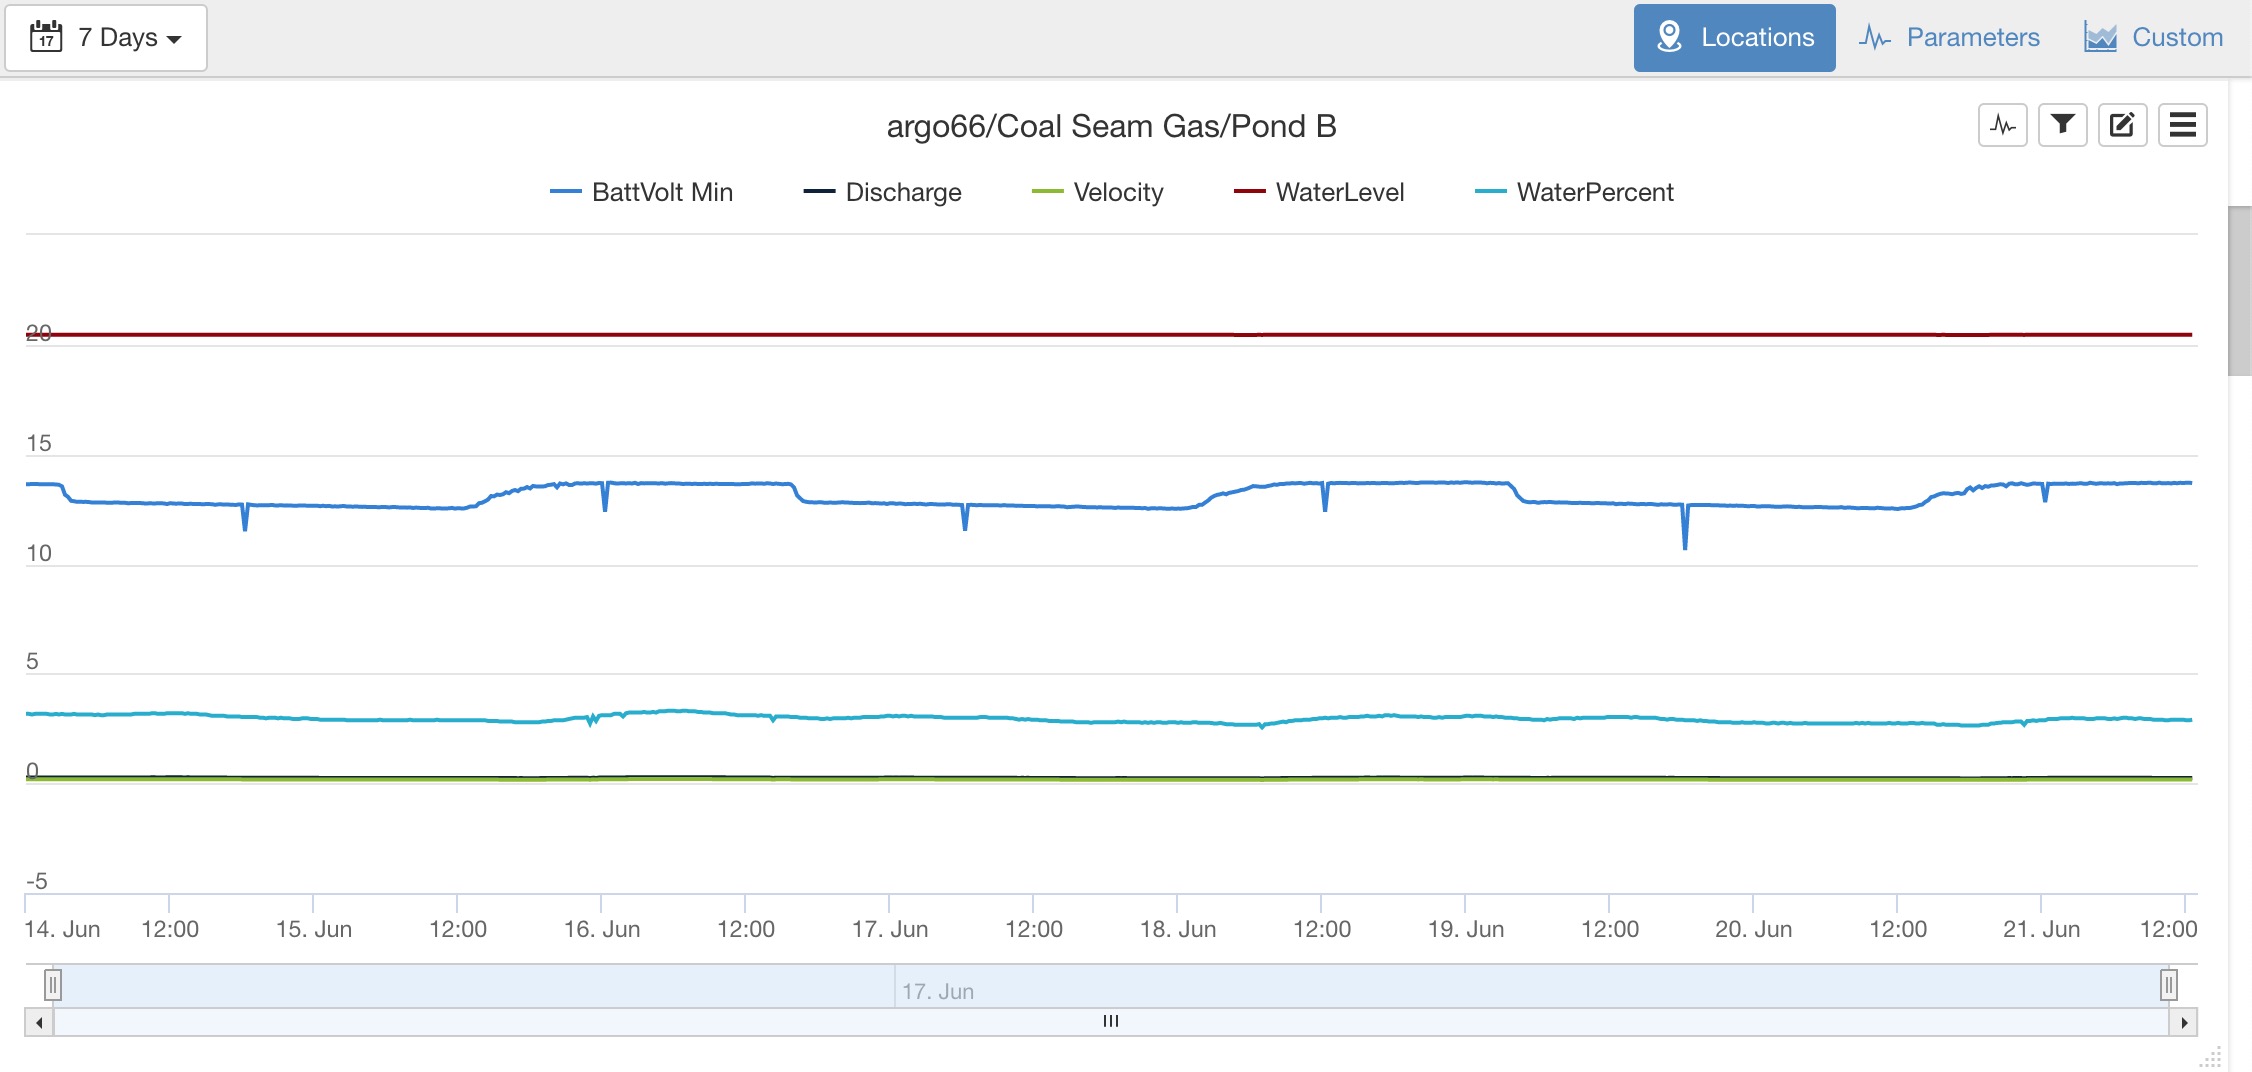
Locations Subview displays a chart per Location. Any Parameters contained within the Location will be displayed on the same chart. If a Location does not contain any Parameters (or the Parameters have been filtered), no chart will be displayed.
Parameters
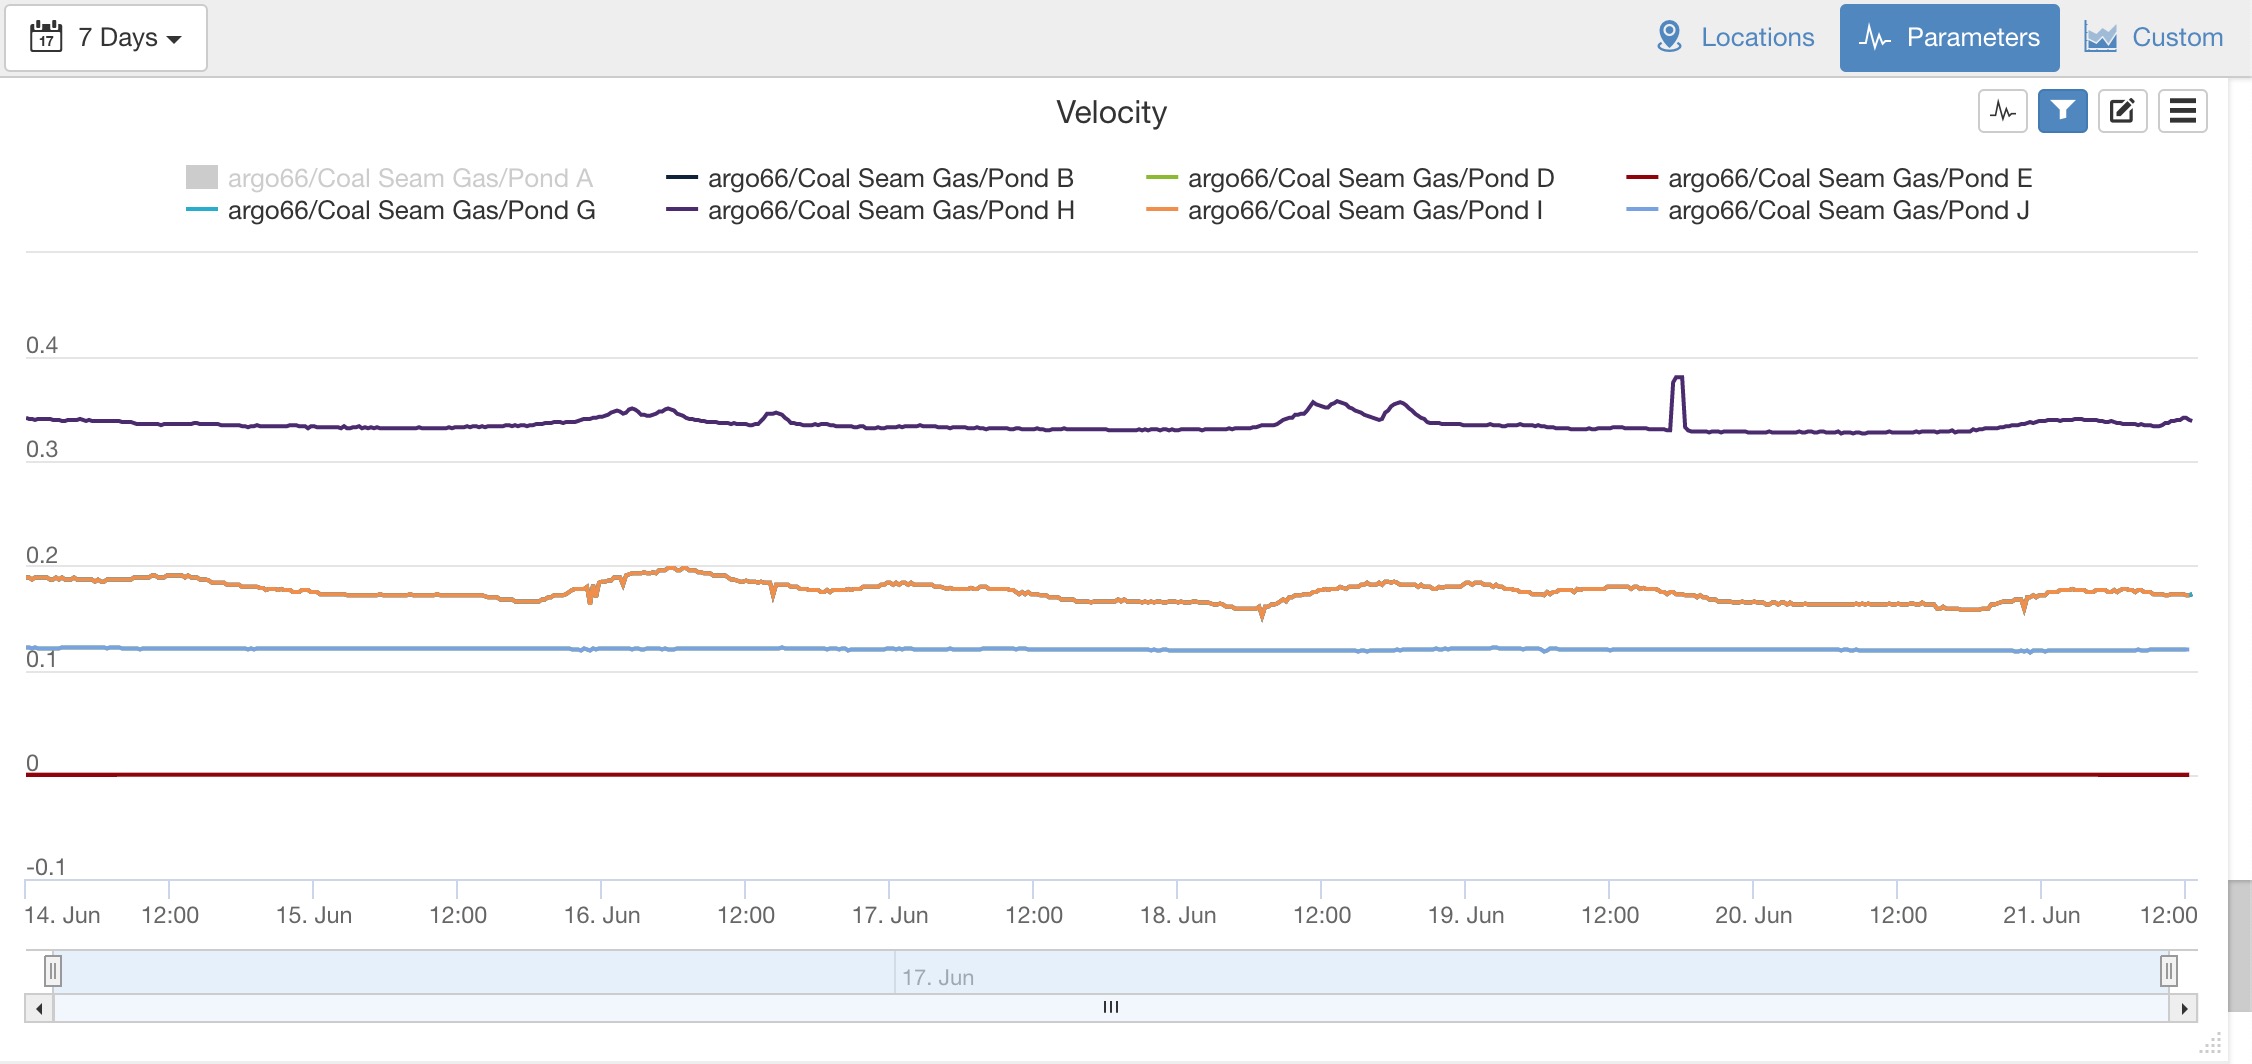
Parameters Subview displays a chart per Parameter (based on Parameter name). Useful for comparing Parameters of the same type across multiple Locations. Filters can be applied to reduce the number of charts and/or Parameters being displayed.
Working with charts
Parameter Values
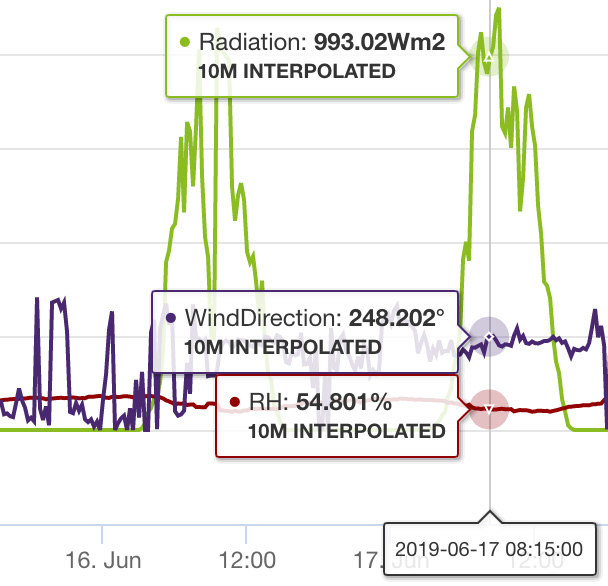
Hover over a chart with the mouse cursor or touch part of the display area of a chart to display the value of the Parameters corresponding with the time on the x-axis.
Parameter values may be shown with aggregation applied - indicated with a duration and aggregate name. Aggregation is based on the date range of the chart data and the Parameter configuration settings. See Parameter configuration for full details.
If you have assigned quality codes to the data, the associated quality code and color is displayed on hover.
Adjust Height
Use the grab handle in the bottom right corner of the chart to increase or decrease its height. This option is currently not available on touch devices.
Zoom
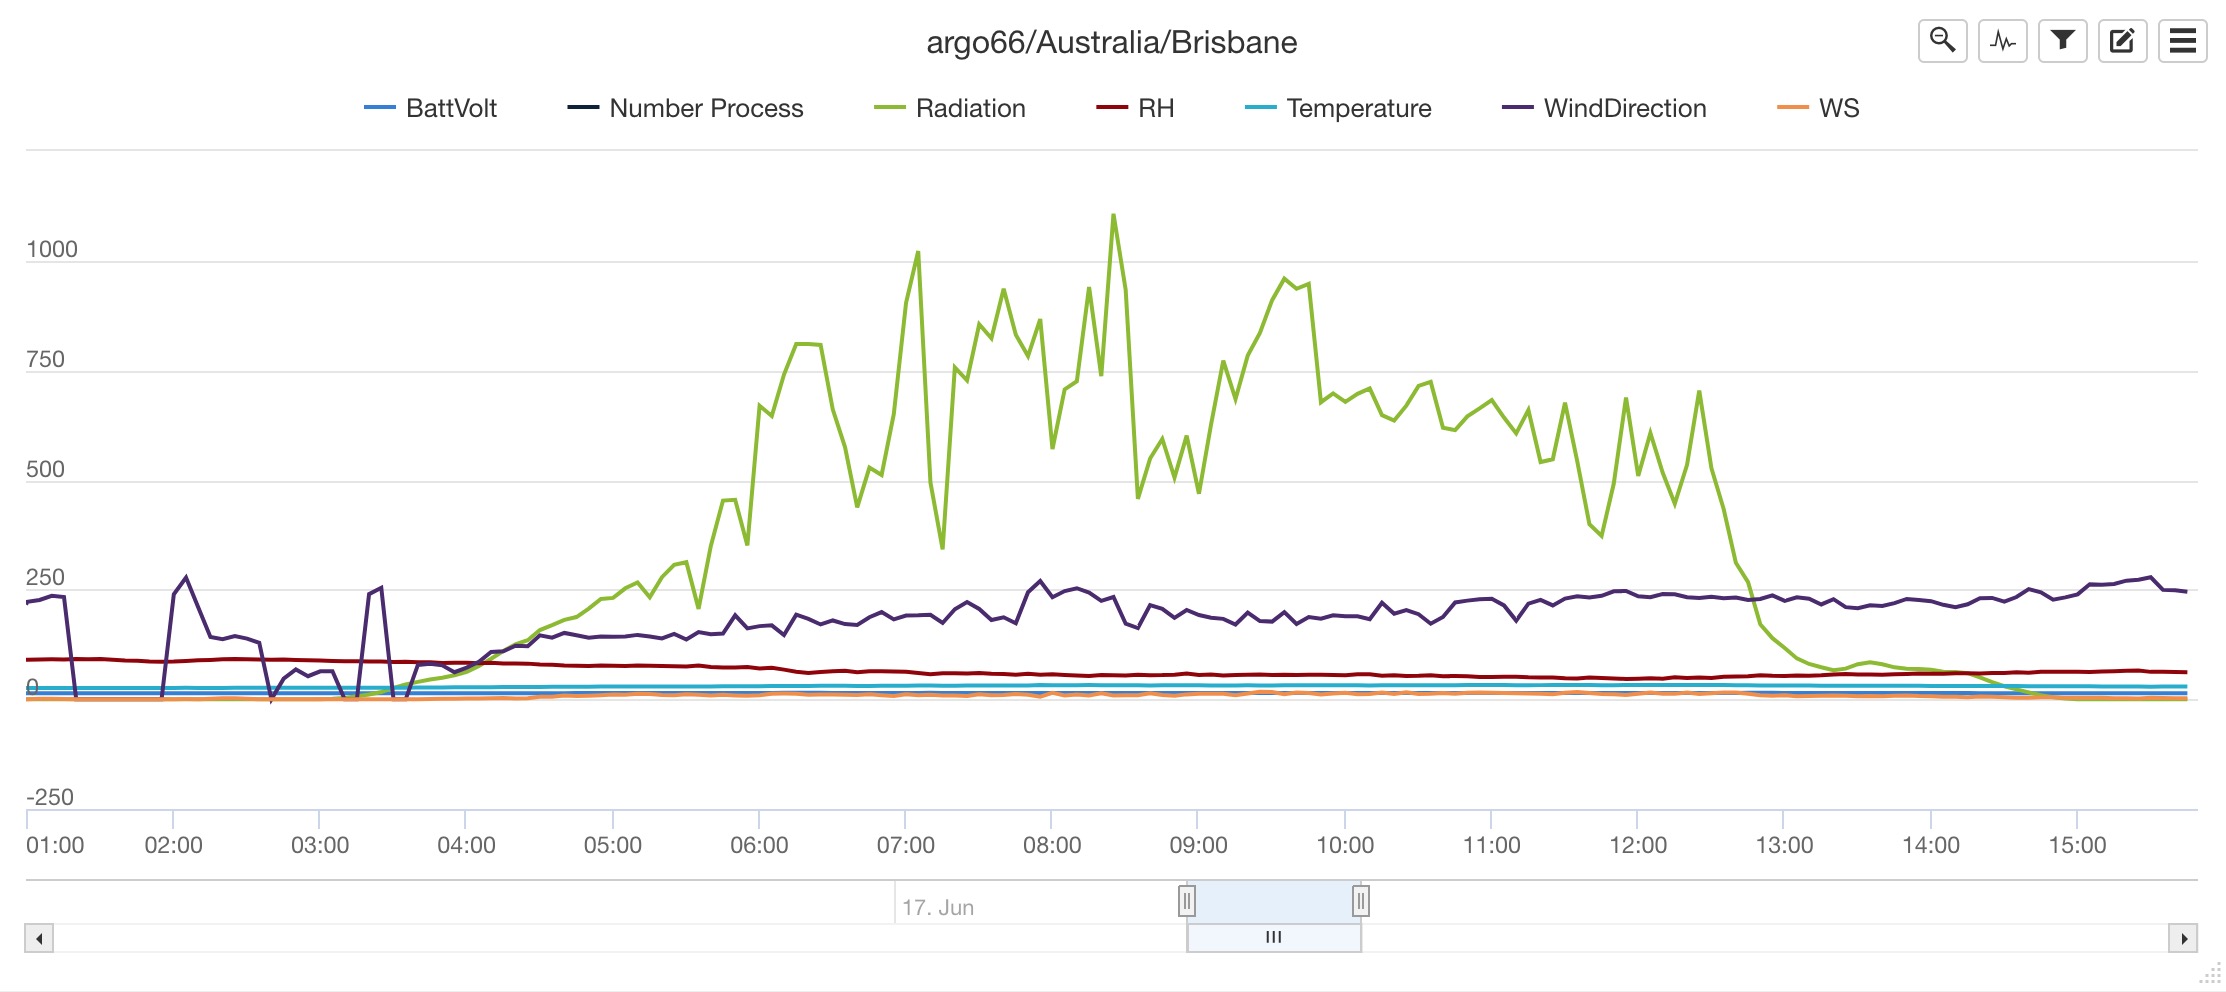
 Click and Drag (or pinch on touch devices) over the main chart area to zoom.
As you zoom into the chart, higher resolution data is loaded for the selected period (depending on the parameter configuration settings).
Click and Drag (or pinch on touch devices) over the main chart area to zoom.
As you zoom into the chart, higher resolution data is loaded for the selected period (depending on the parameter configuration settings).
Use the navigator located directly under the main chart area to pan the chart or zoom in/out. After zooming in on a section of the chart the zoom out icon is displayed in the chart toolbar to reset the zoom range.
Chart area selected for zoom
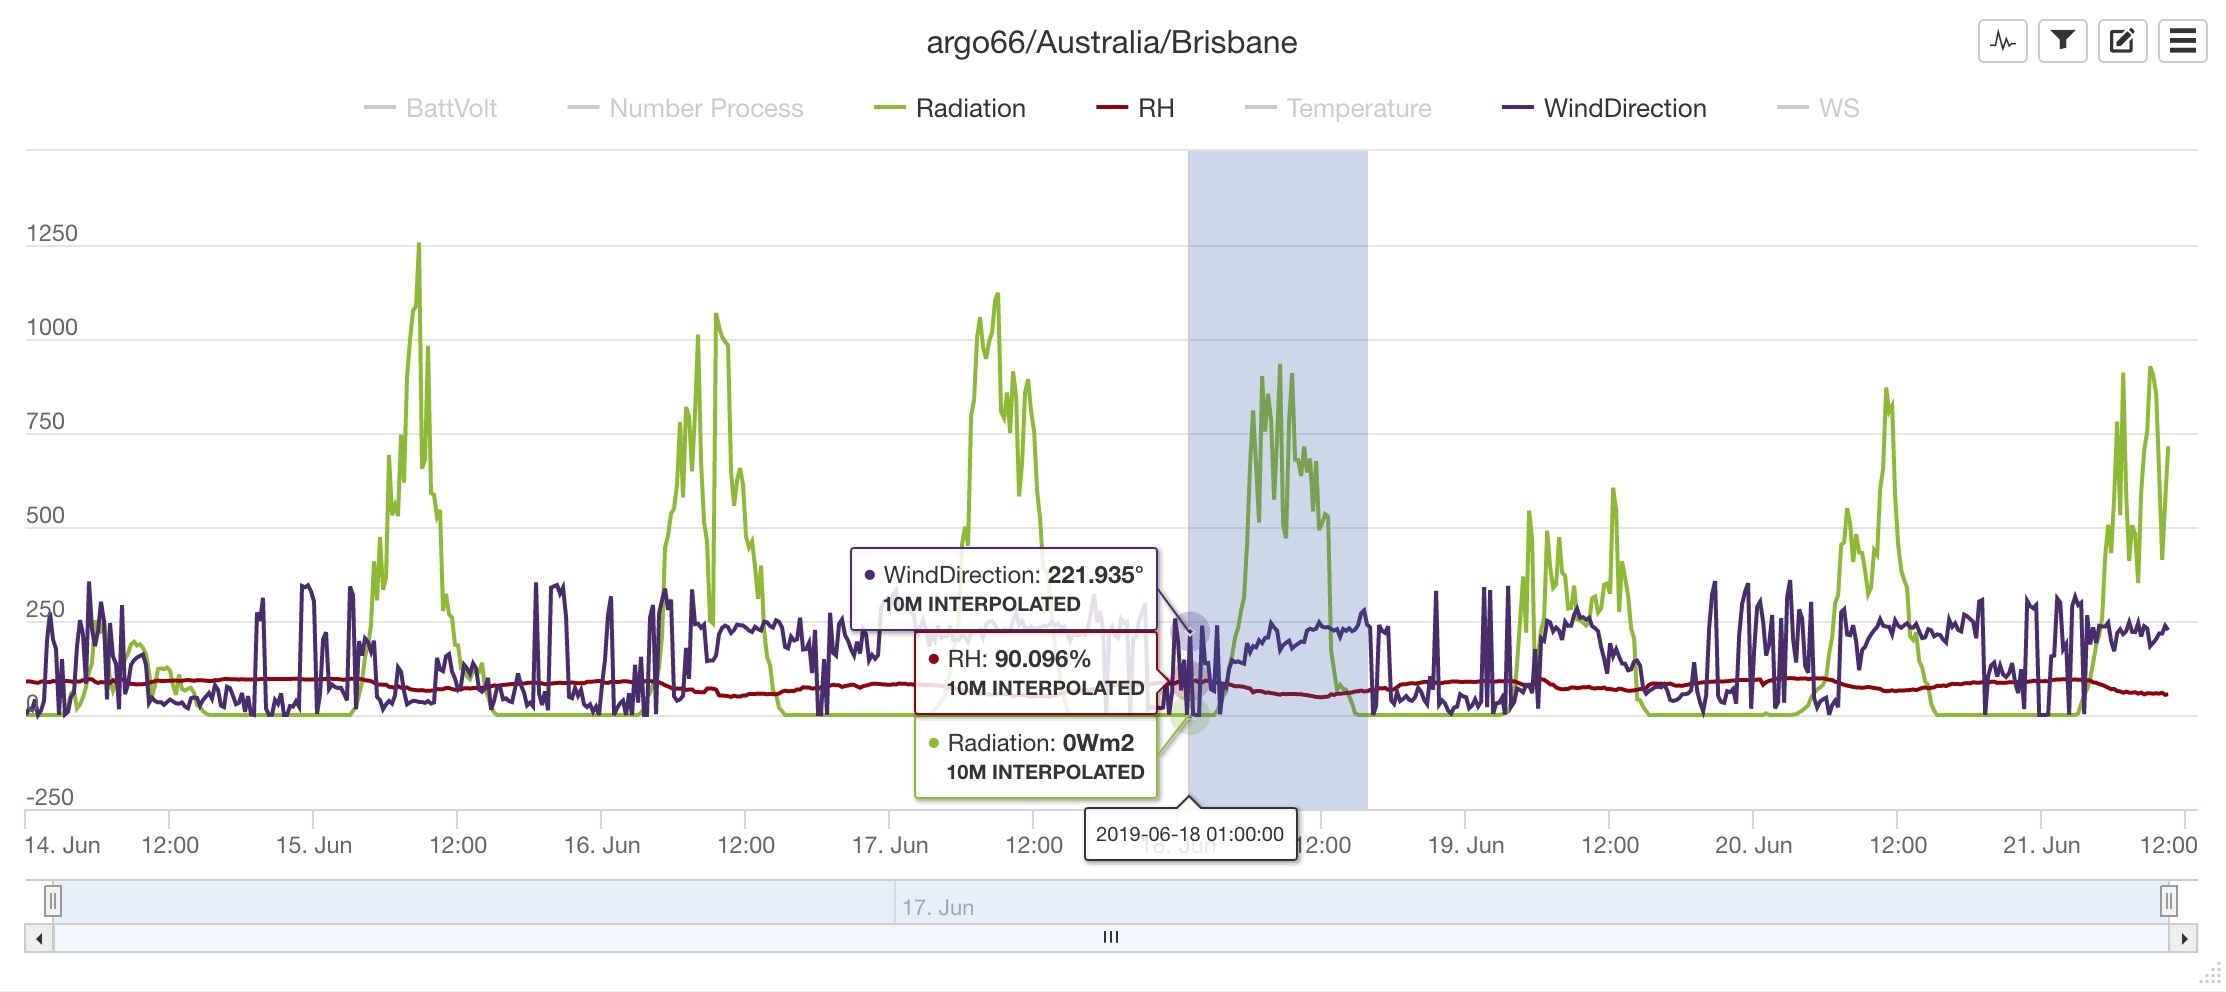
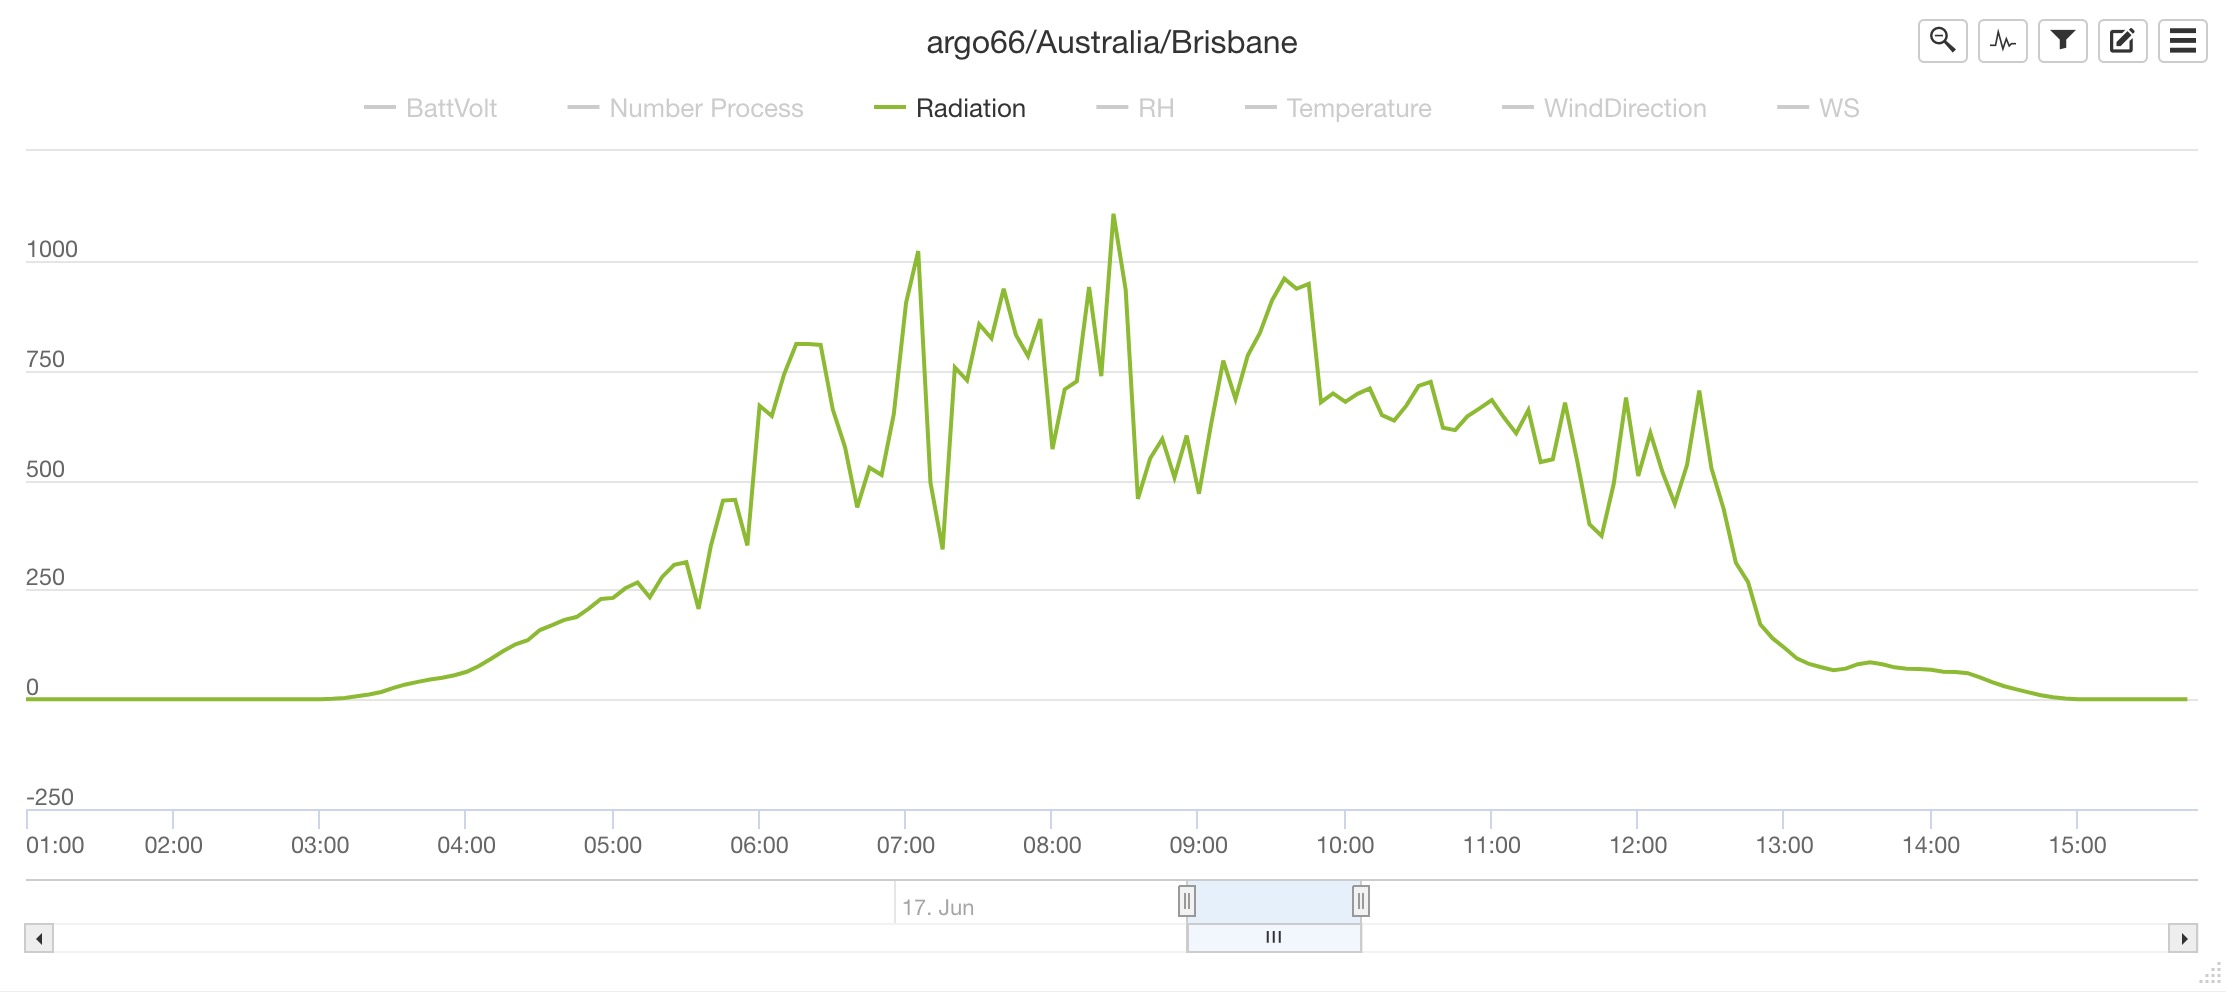
Chart after zoom
Toggle Parameter display
 Click the parameter icon to quickly toggle the visibility of all parameters. Click parameters in the chart legend to toggle the visibility of individual parameters.
Change date range
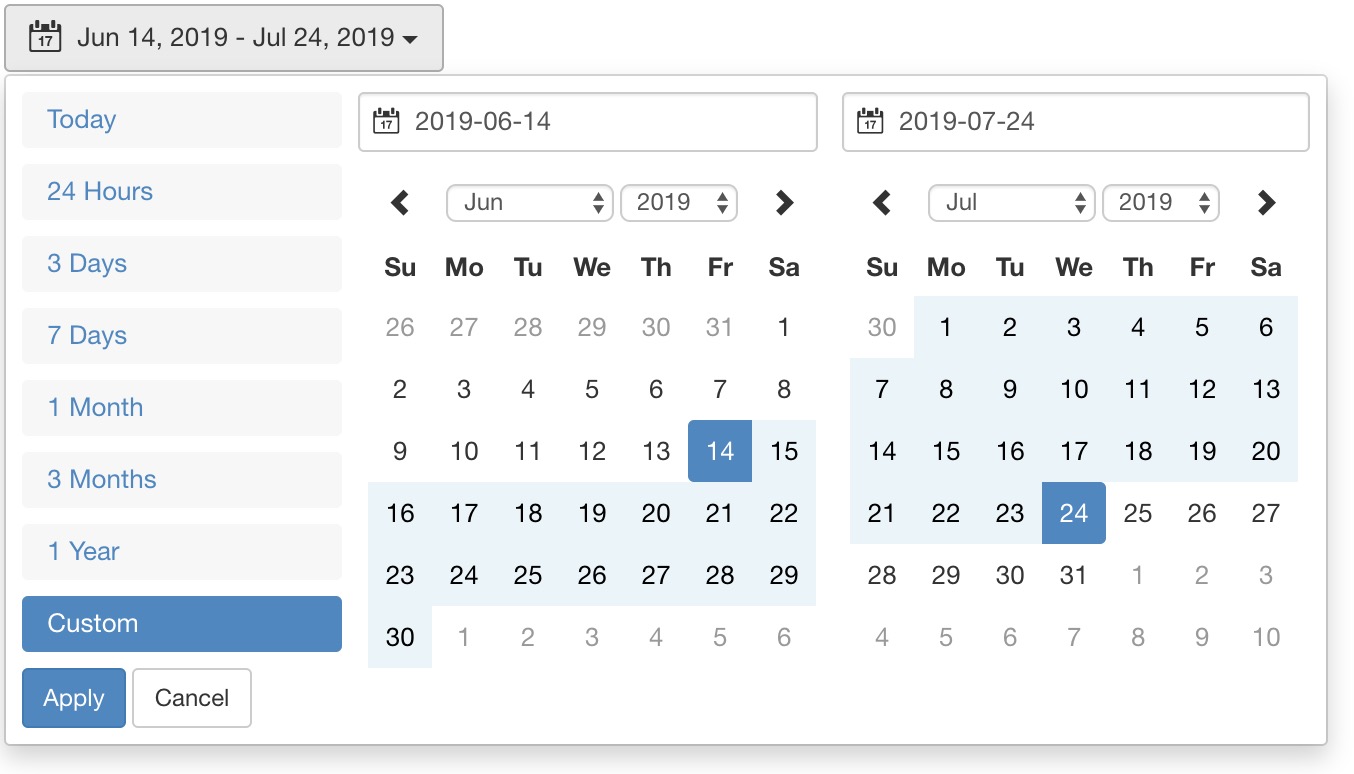
 Date range selector is used to quickly adjust the date range being shown on all charts. You can always zoom in on individual charts, but you cannot zoom out past the range set by this selector. Use Custom Range to select precise start/end dates.
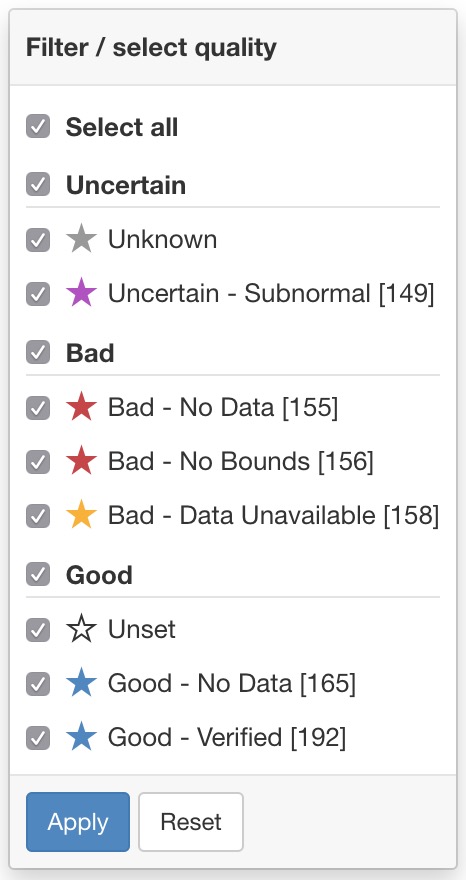
Filter data on quality
 Filter the dataset by selecting quality codes associated with the data points that you want to include.
While editing data, apply filters to automatically select associated data points and temporarily hide filtered data points to prevent modification.
Filter the dataset by selecting quality codes associated with the data points that you want to include.
While editing data, apply filters to automatically select associated data points and temporarily hide filtered data points to prevent modification.
 The dropdown menu allows you to print or save the chart as an image.
Edit chart data
 Use this feature to toggle into data editing mode and display the data editing toolbar.
Please refer to the data editing documentation for further details.
Use this feature to toggle into data editing mode and display the data editing toolbar.
Please refer to the data editing documentation for further details.
