Historic
Historic charts allow for more customization over the default Location and Parameter charts available in Chart View. You can create multiple y-axes with fixed or automatic scaling, change the data aggregation and styles of individual parameters and preset the default time range.
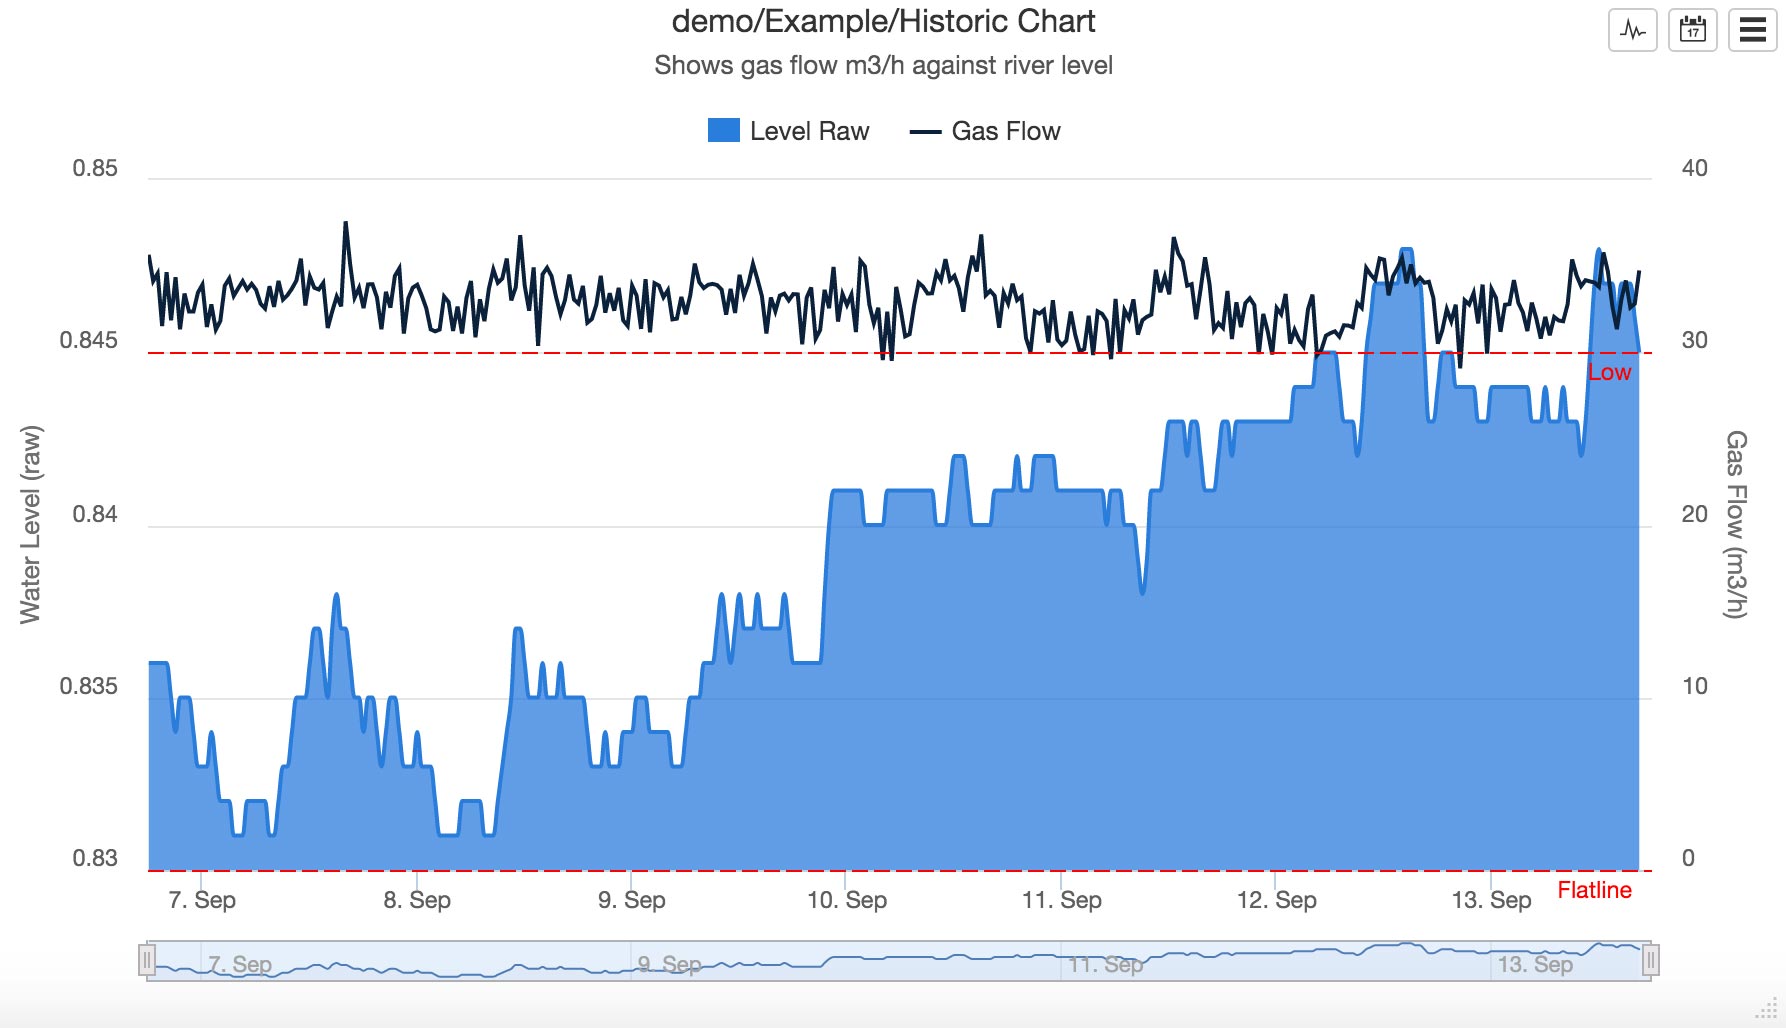
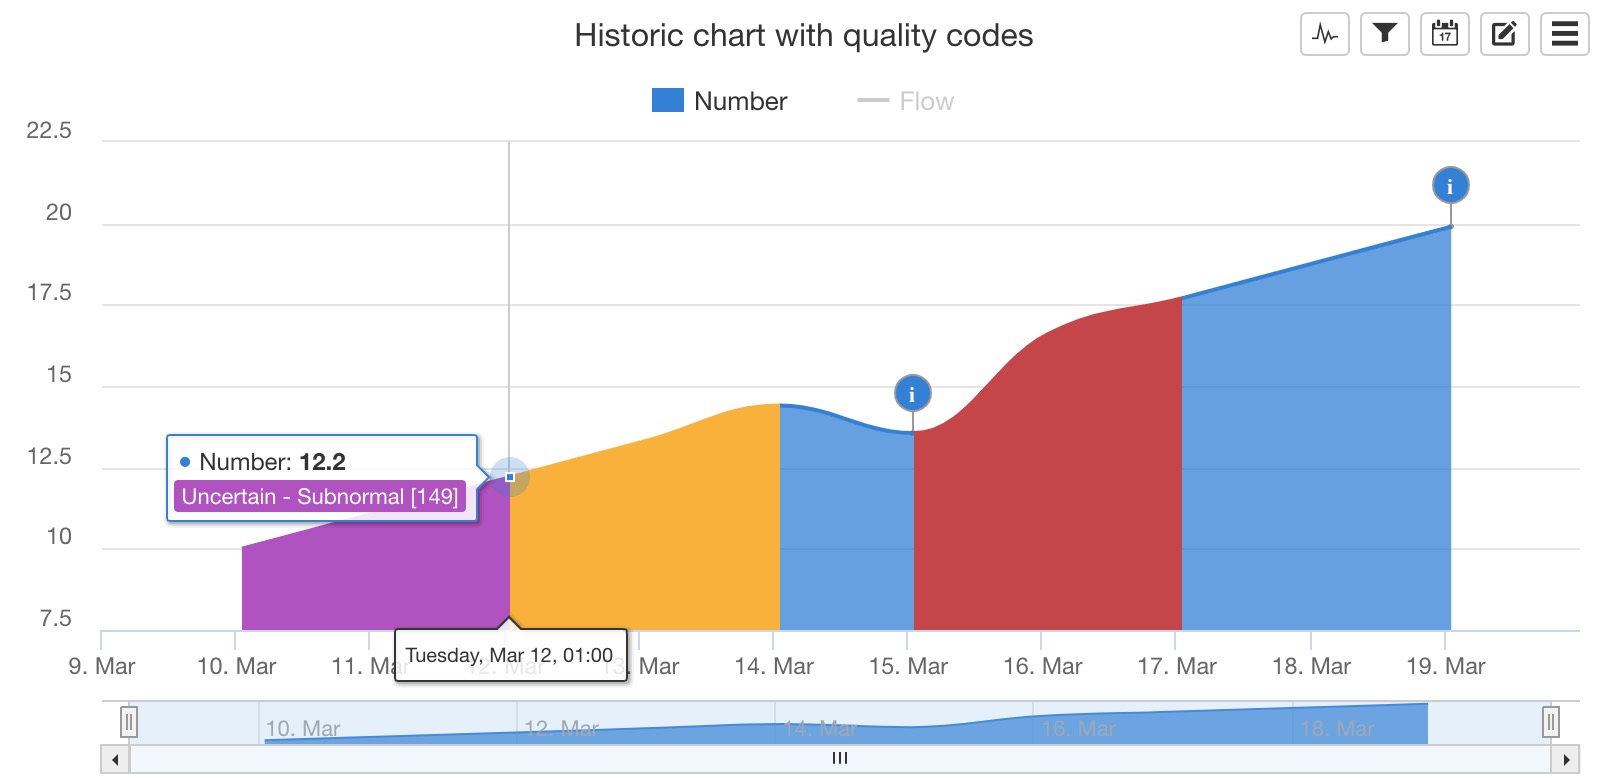
You can customize the chart to visually indicate assigned quality codes via associated quality colors. Refer to Quality style in Parameter chart configuration.
Properties
 Configure properties via the Workspaces Tree’ context menu. Requires configure permission.
General
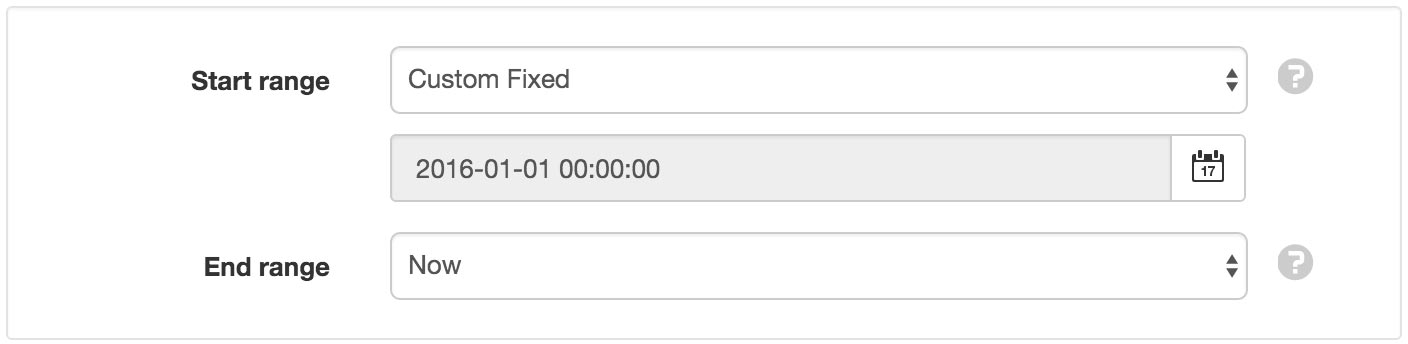
The General section allows a default Start range and End range to be set. This range will be used when the chart is initially displayed. Choose a preset or Custom OPC for relative time. Select Custom Fixed for absolute time.
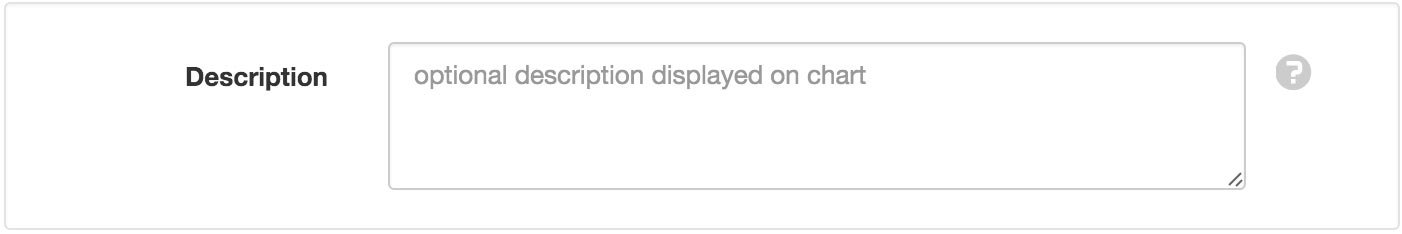
Optionally enter a description to be displayed on the chart below the title.
Axes
The Axes section allows you to customize the style and functionality of the X-axis and Y-axes of the chart.

Y Axes
You can create unlimited y-axes to be displayed on the chart.
Click the Edit button to show and modify the configuration for each y-axes. Use the Add Y axis button to create a new axis. Axes can be removed via the dropdown menu (accessible by clicking the menu button on the top-right corner of the axis item).
Y-axes can be linear with automatic or fixed minimum and maximum ranges or displayed with logarithmic scaling.
Drag and drop axes in the list to change their display order on the chart.
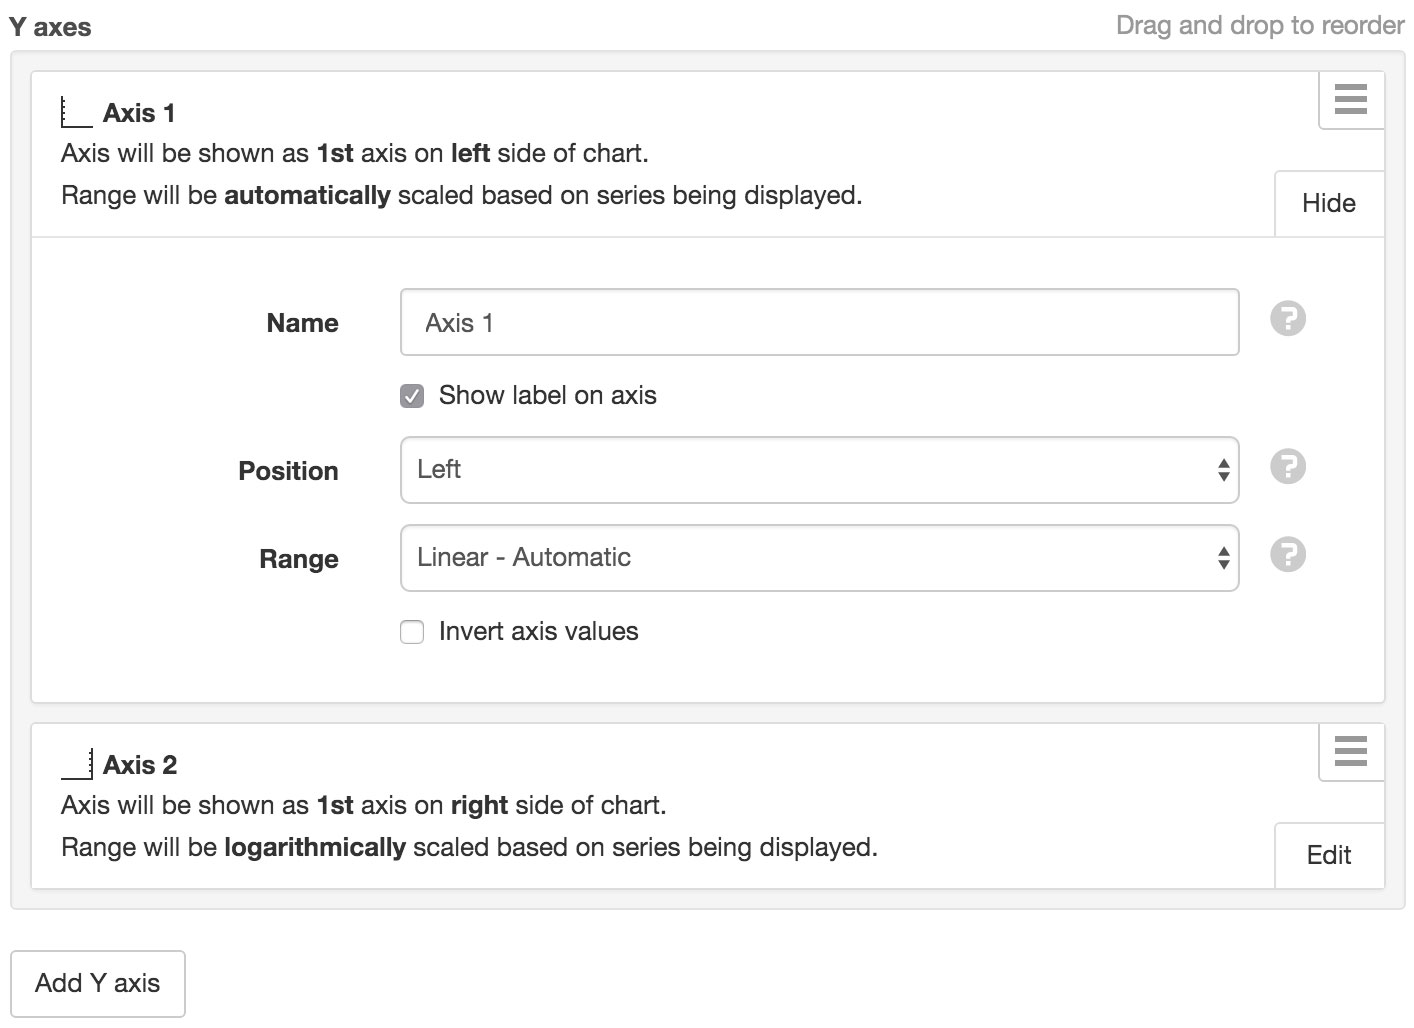
Note
By default, links are automatically assigned to the first y-axis. You need to Edit each link and specify a Y axis.
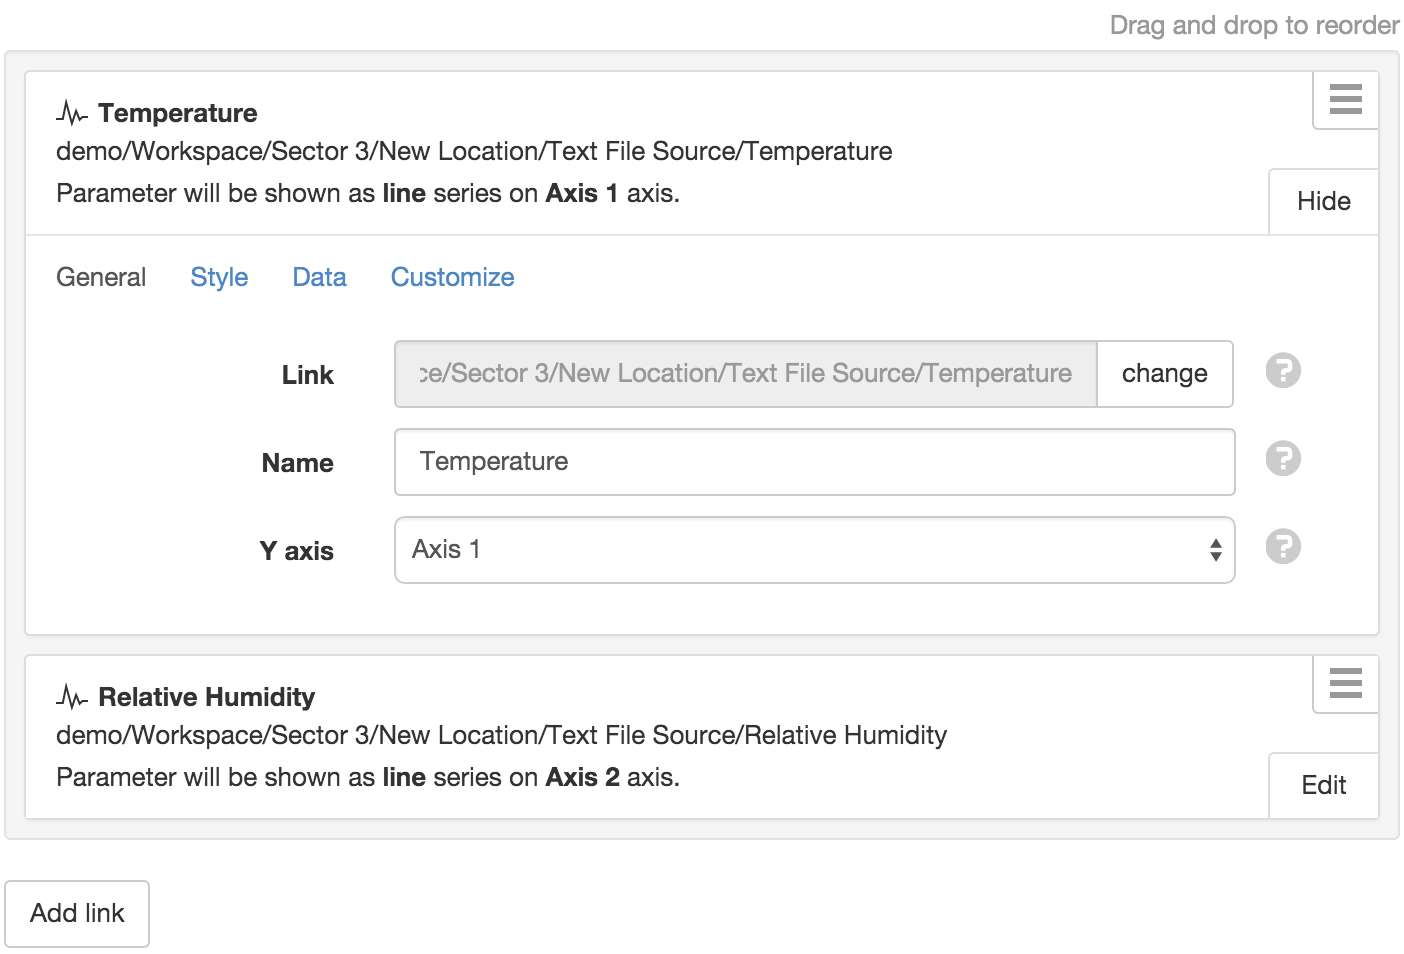
Links
Links assign Nodes in the Workspaces Tree to the chart so the corresponding data can be displayed and updated live.
Click the Edit button to show and modify the configuration for each link. Use the Add link button to display the Workspaces Tree and select a new Node to link. Links can be removed via the dropdown menu (accessible by clicking the menu button on the top-right corner of the link item).
Charts can not have links to Nodes in different Workspace and currently do not support the same nodes being linked more than once to the same chart.
Drag and drop links in the list to change their display order on the chart.
Refer to Parameter chart configuration for a description of all available settings.
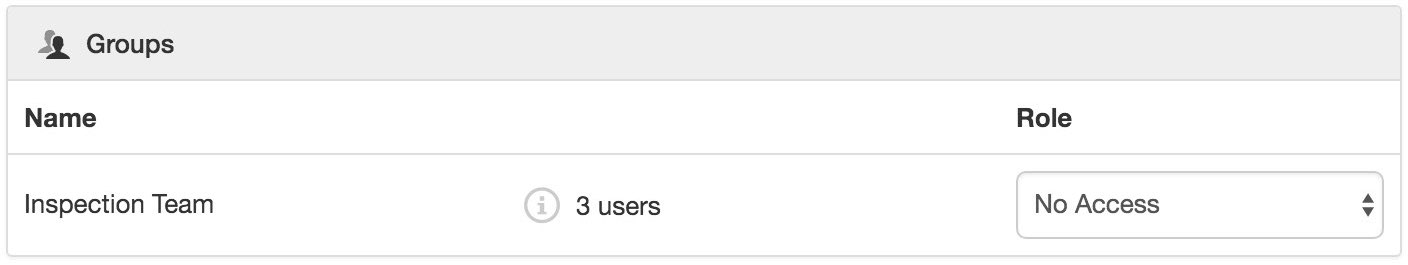
Security
The Security section displays a list of all users and groups that have access to the Node. Users with security permission can restrict user and group access to the node and its descendants by assign the No Access role.
New users and groups must be added via the Workspace Security section.
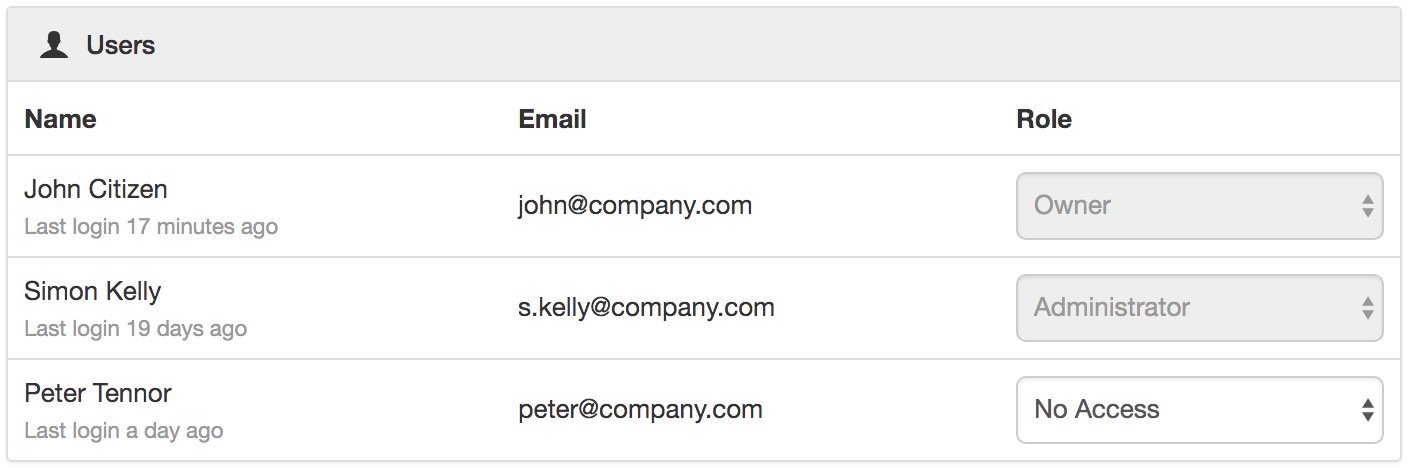
Note
The Account Owner, Administrators or Workspace users/groups that have been assigned a Workspace role with the configure permission can not be assigned the No Access role.
Public Access
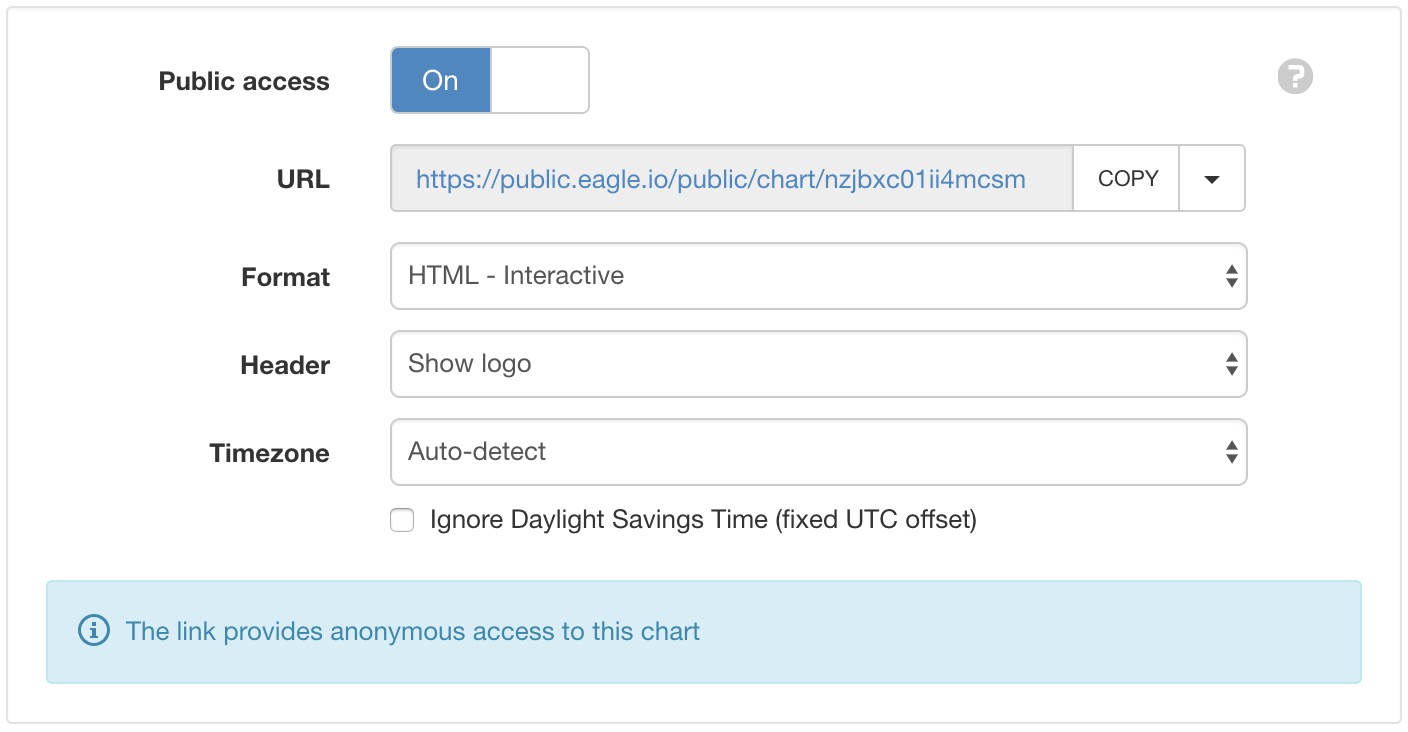
Enabling public access allows anyone to view the node (attachment, chart, dash, report or historic data) using the generated URL.
You can also embed charts and dashboards into your own website with basic HTML. Select Copy embed HTML from the URL dropdown menu for a generic code snippet (you will need to paste this in to your website). You can also revoke and replace the automatically assigned URL by selecting the Generate new URL option in the menu.
Use the available options to customize the URL based on your display preferences. These options are transient and you can use multiple variations of the URL at the same time.
Note
This feature is not included in Starter accounts.
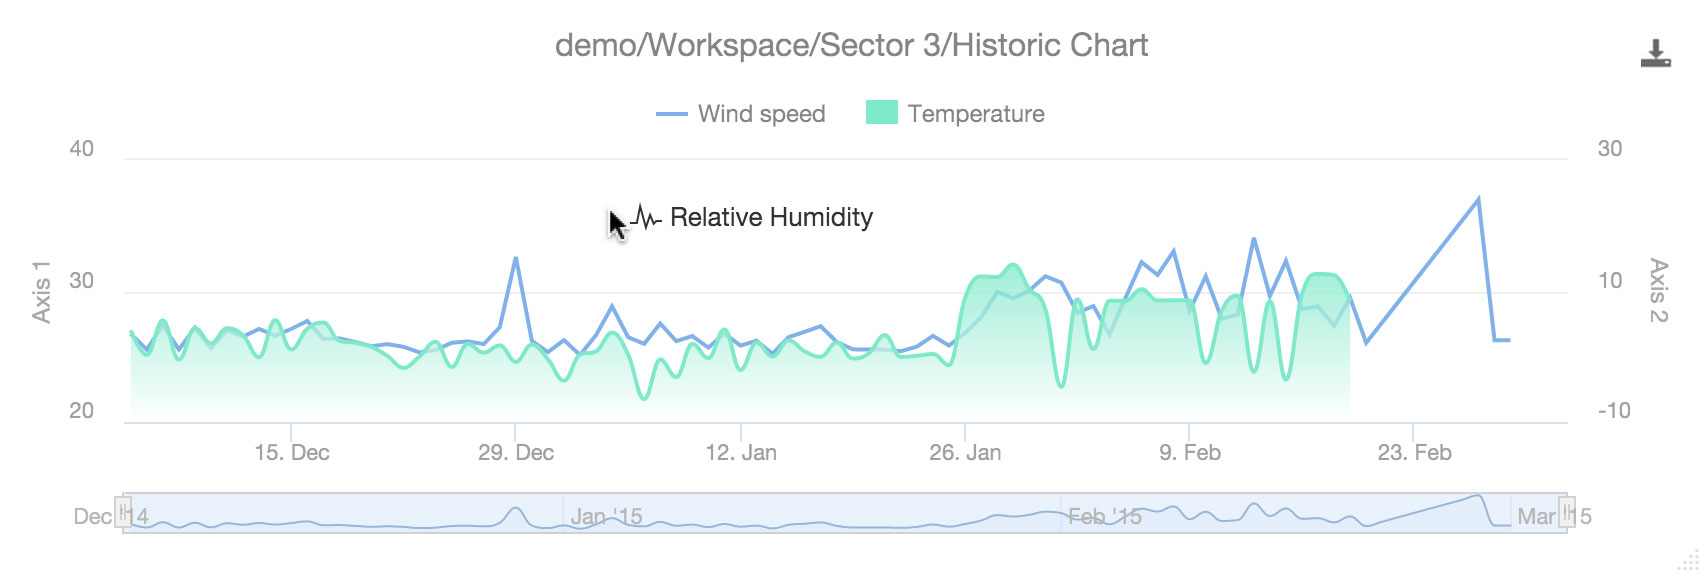
Drag and Drop Links
Nodes can be dragged with a mouse directly from the Workspaces Tree and dropped onto applicable charts (indicated with drop-accept and drop-blocked mouse cursor icons).
Copy/Paste Charts
 Copy/Paste operations can be performed from the Workspaces Tree to quickly duplicate one or more charts. Links are automatically re-assigned to corresponding Nodes relative to the chart if they exist at the destination. ie. You can copy/paste complete Locations containing charts without manually re-assigning all Links.
Move Charts
 Moving a chart within a Workspace will keep existing links. Moving a chart between Workspaces will invalidate any Link where the linked node is not available in the destination Workspace.
Link error
 If a linked Node is removed or not accessible after a copy/paste or move operation then the chart will display the Link error icon to indicate a problem with one or more Links. Links can be removed or reconfigured from the Links section in the chart properties dialog.