Dash
 The Dash is for selecting and viewing the customized graphical dashboards.
Overview
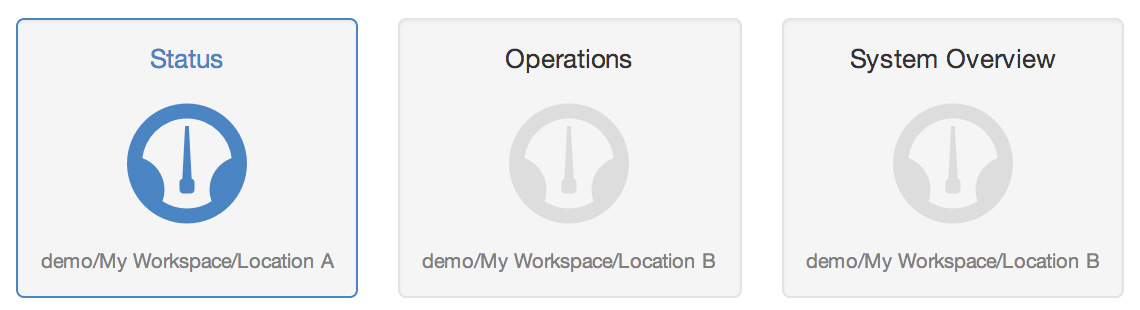
 The dashboards overview is displayed when a container Node is selected in the Workspaces Tree. All dashboard Nodes within the Selected Node are shown. Click on a dashboard to select it for display. When viewing an individual Dashboard you can click the Overview button to get back to this view.
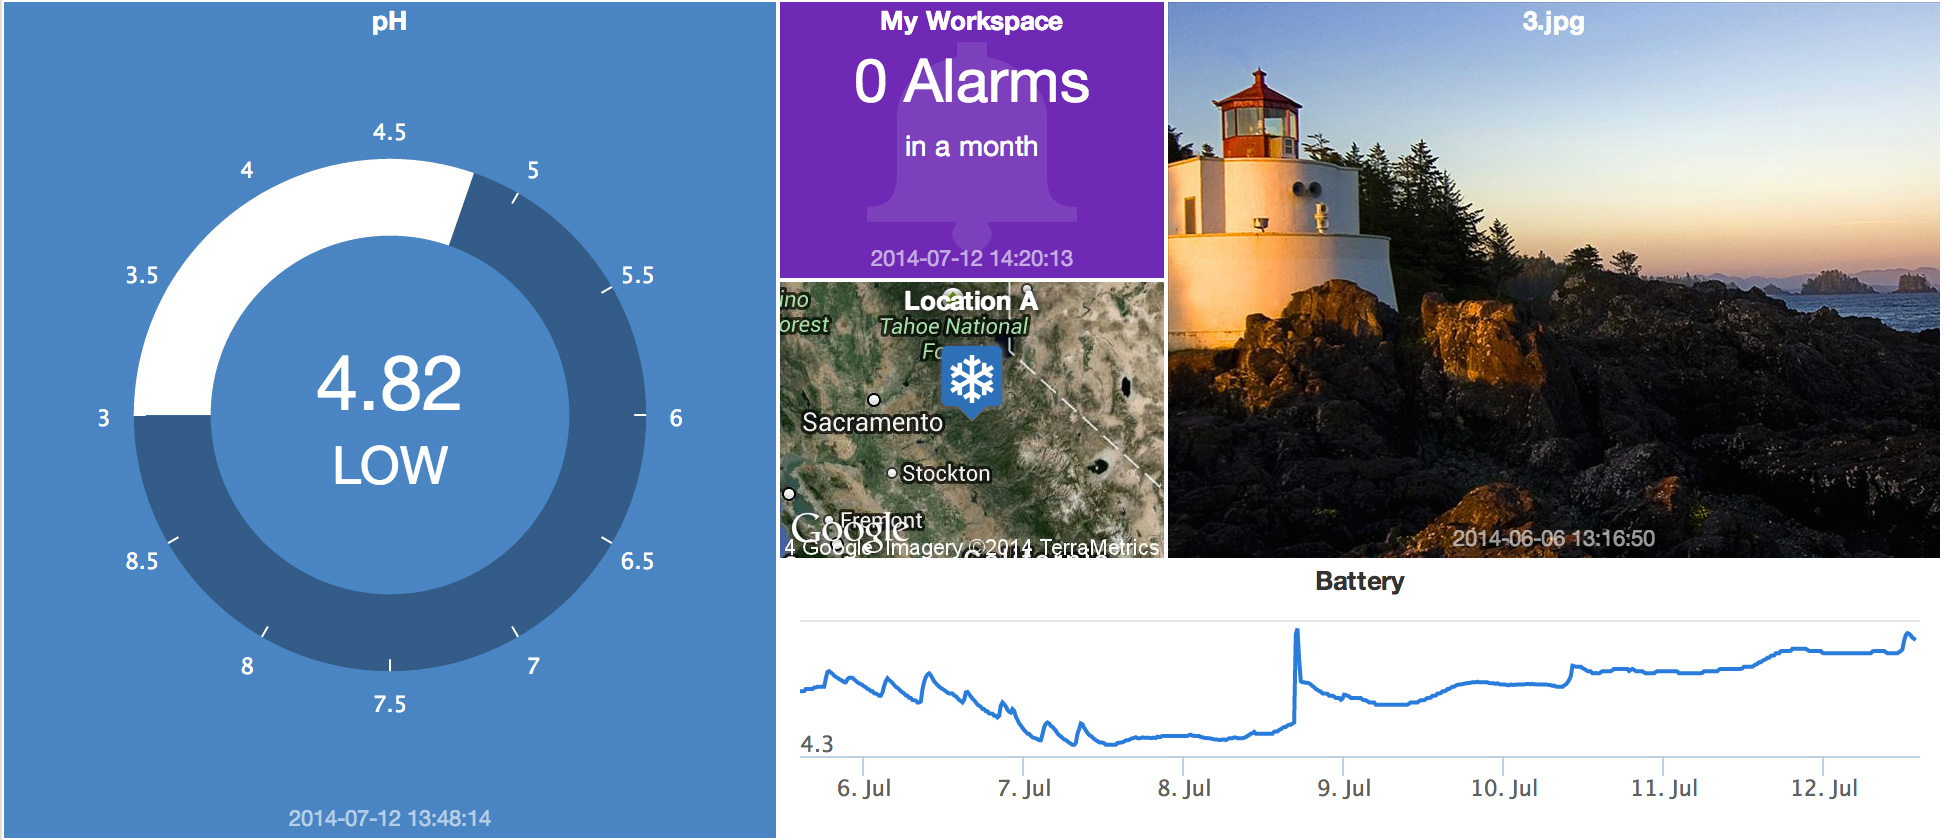
Dashboard view
Dashboards contain user configurable tiles which can be linked to Nodes to display your important data in real-time with live updates. Tile layout is automatically adjusted on mobile devices.
Refer to Dashboard configuration for Creating and working with Dashboards.