Displacement
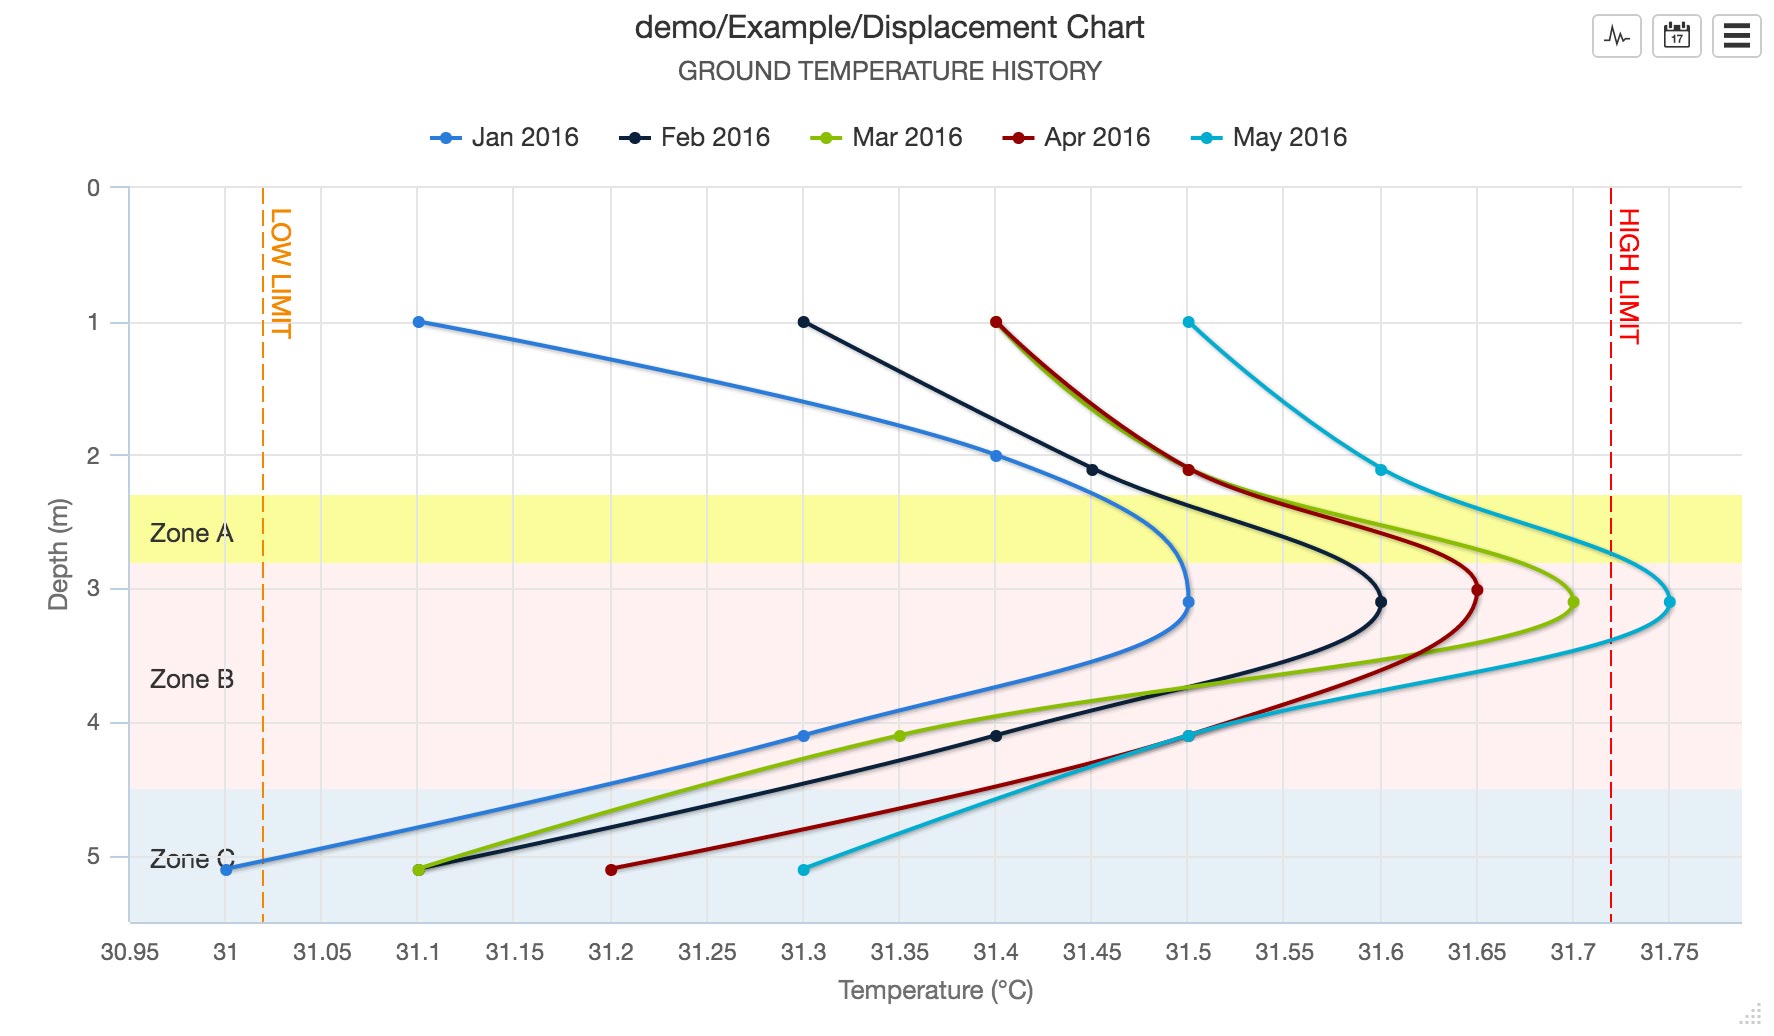
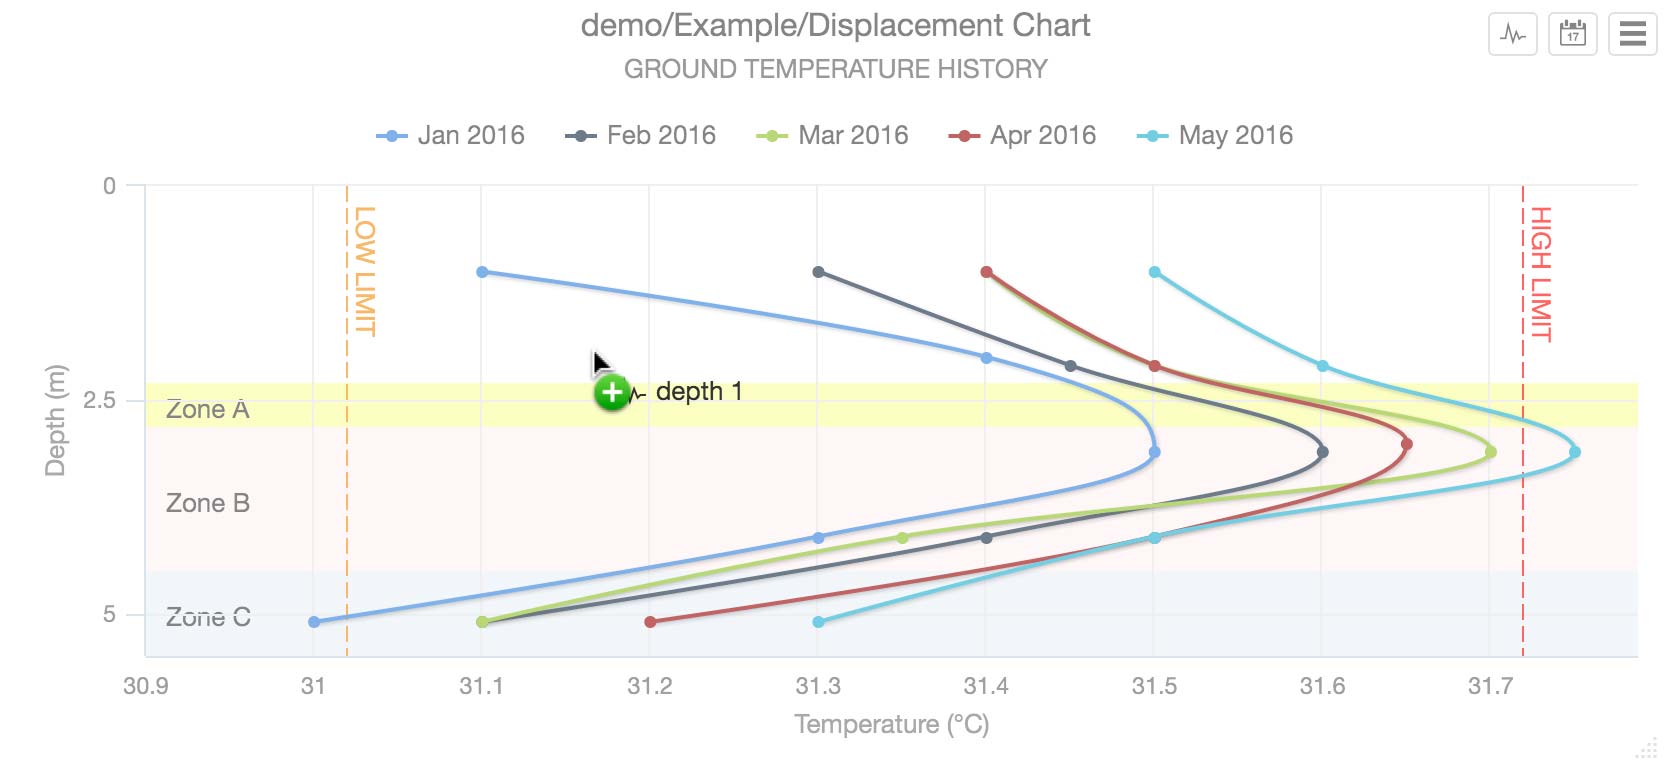
Displacement charts allow you to visualize vertical or horizontal measurement displacement over time. Typically, instruments that require displacement charts are on a string along a line, either down a borehole, along a structure or underneath embankments.
Properties
 Configure properties via the Workspaces Tree’ context menu. Requires configure permission.
General
The General section allows a default Start range and End range to be set. This range will be used when the chart is initially displayed. Choose a preset or Custom OPC for relative time. Select Custom Fixed for absolute time. The None option can be used to read forward or back through the time series data until the Maximum series limit is reached.

You can customize the chart with a number of other general settings:
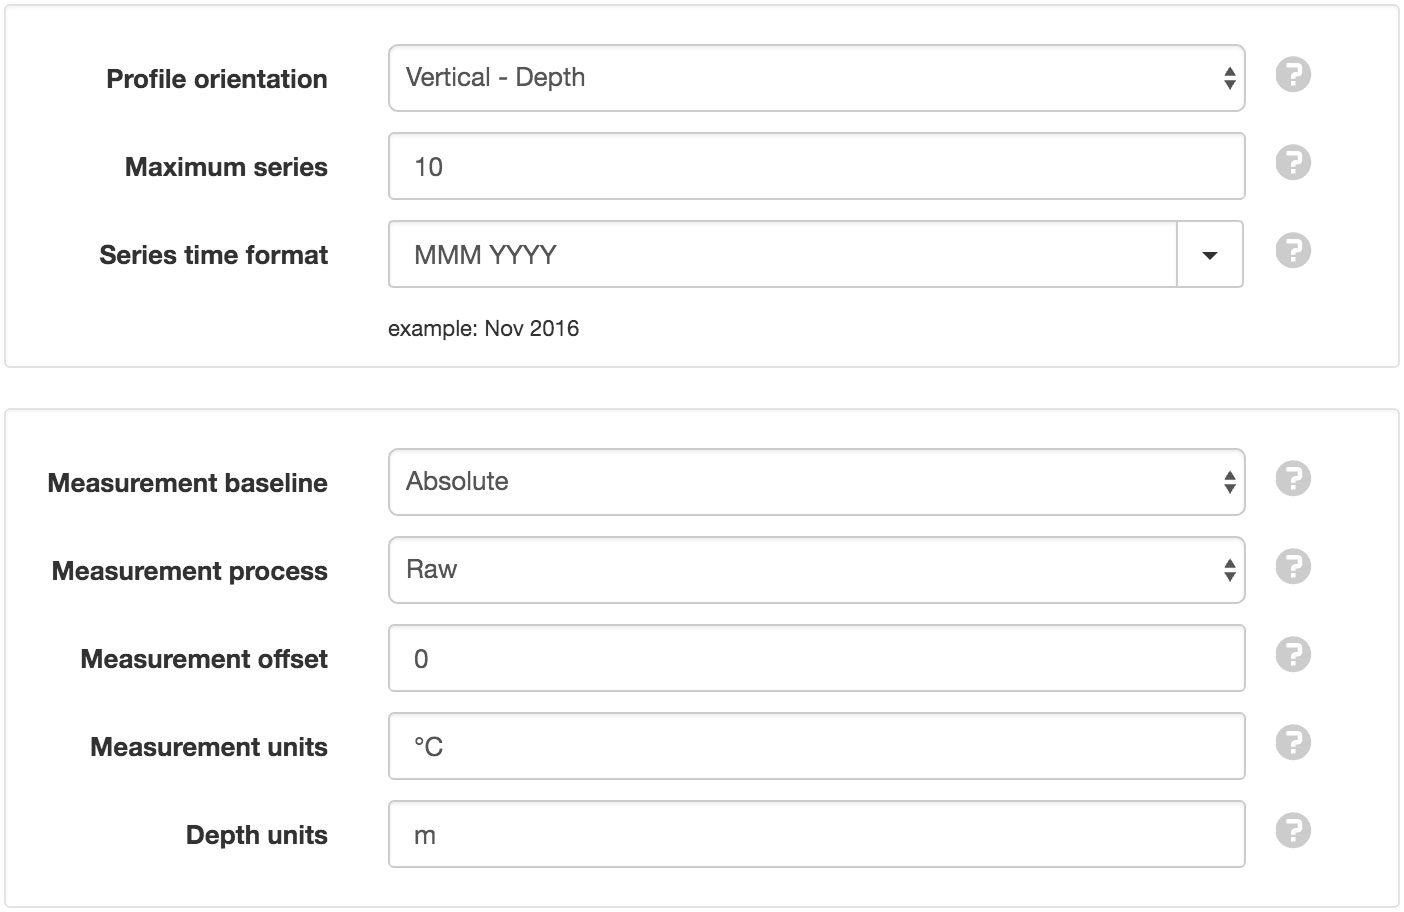
- Profile orientation
- Vertical displays depth on Y-Axis and measurement on X-Axis. Horizontal displays distance on X-Axis and measurement on Y-Axis.
- Maximum series
- The maximum number of series to display on the chart (between 1 and 15).
- Series time format
- Select a preset display format from the drop down list or specify a custom format using time format tokens.
- Measurement baseline
Absolute: Measurements are not modified.
Relative to first value in range: Measurements from first series in requested range are subtracted from all subsequent series.
Relative to first recorded value: Measurements from first series in parameter history are subtracted from all subsquent series.
Relative to fixed time: Measurements from series at a user-defined time are subtracted from all subsquent series. Select the time from the control below this option.
- Measurement process
- Processing to apply to all measurement values. Raw will not apply any processing. Sum from Start and Sum from End will totalise measurement values.
- Measurement offset
- Numeric value to add/subtract from each measurement value.
- Measurement units
- Suffix to display with measurement values.
- Depth/Distance units
- Suffix to display with the depth/distance values.
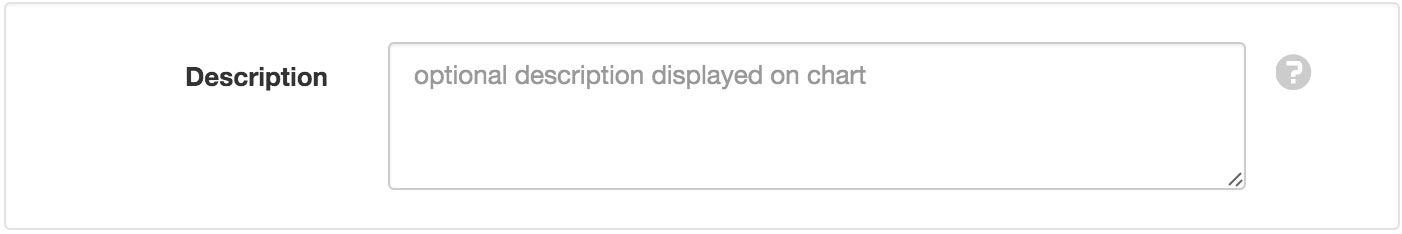
Optionally enter a description to be displayed on the chart below the title.
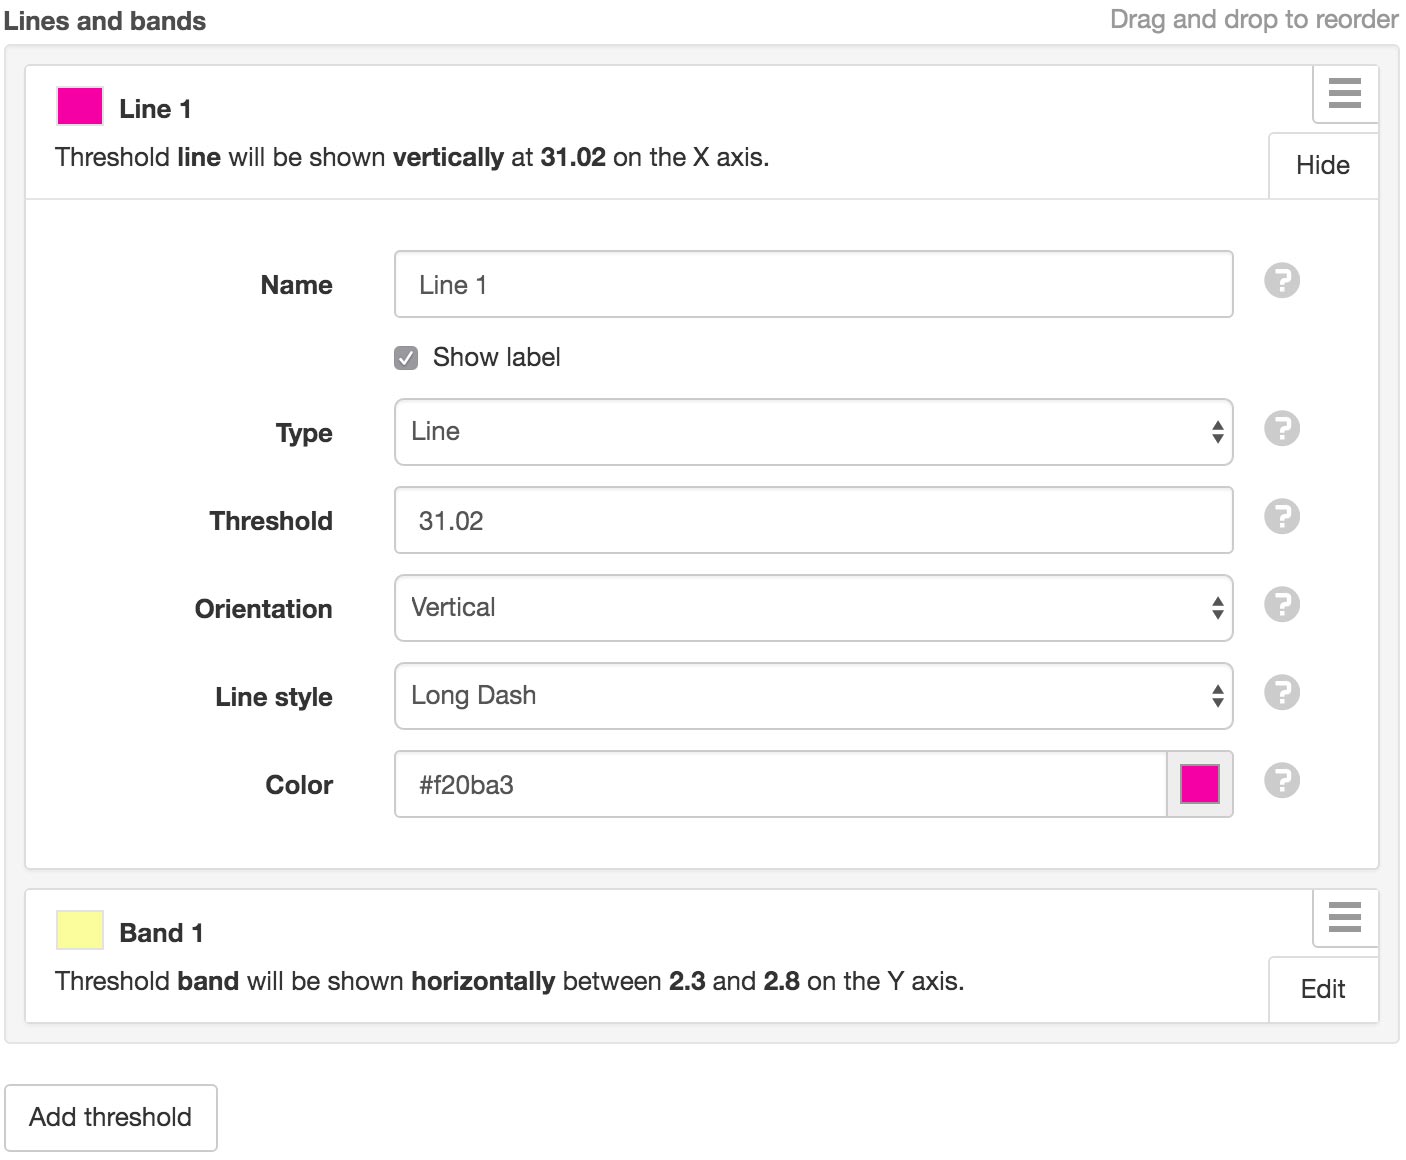
Thresholds
Threshold lines and bands can be added to the chart and displayed either horizontally or vertically. The threshold value for a line will determine where the line is placed on the axis. The threshold start and threshold end values for a band will determine the band position on the axis.
Drag and drop thresholds in the list to change their display order on the chart. Thresholds can be removed via the dropdown menu (accessible by clicking the menu button on the top-right corner of the threshold item).
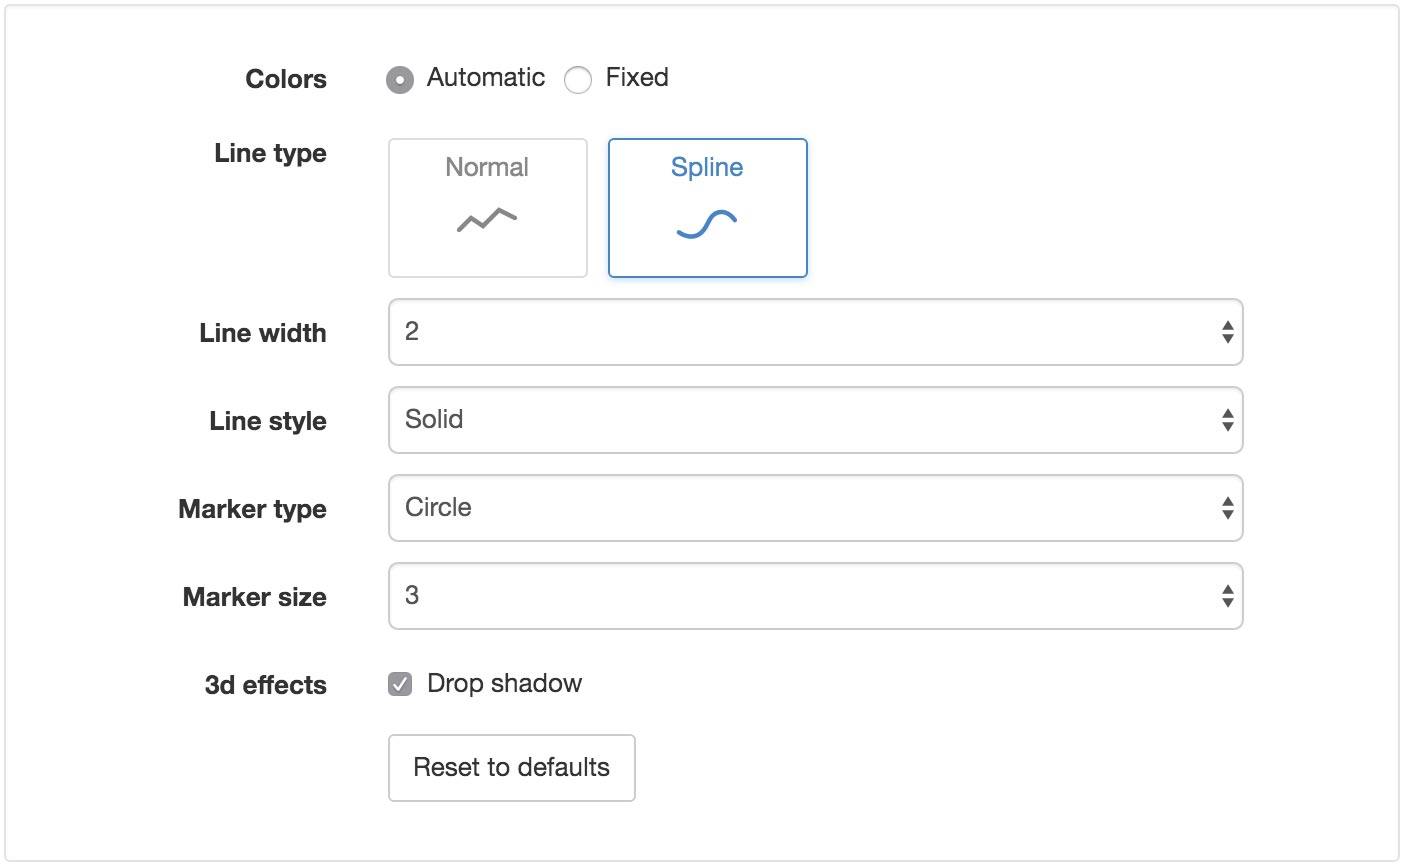
Style
Use the style section to change the appearance of the chart series. Refer to parameter chart configuration for a description of all available settings.
Data
Use the data section to set the aggregation mode for time series data to be displayed on the chart. The aggregation mode applies to the measurement data, while the aggregation period applies to the time ranges. Refer to parameter chart configuration for a description of all available aggregation settings.
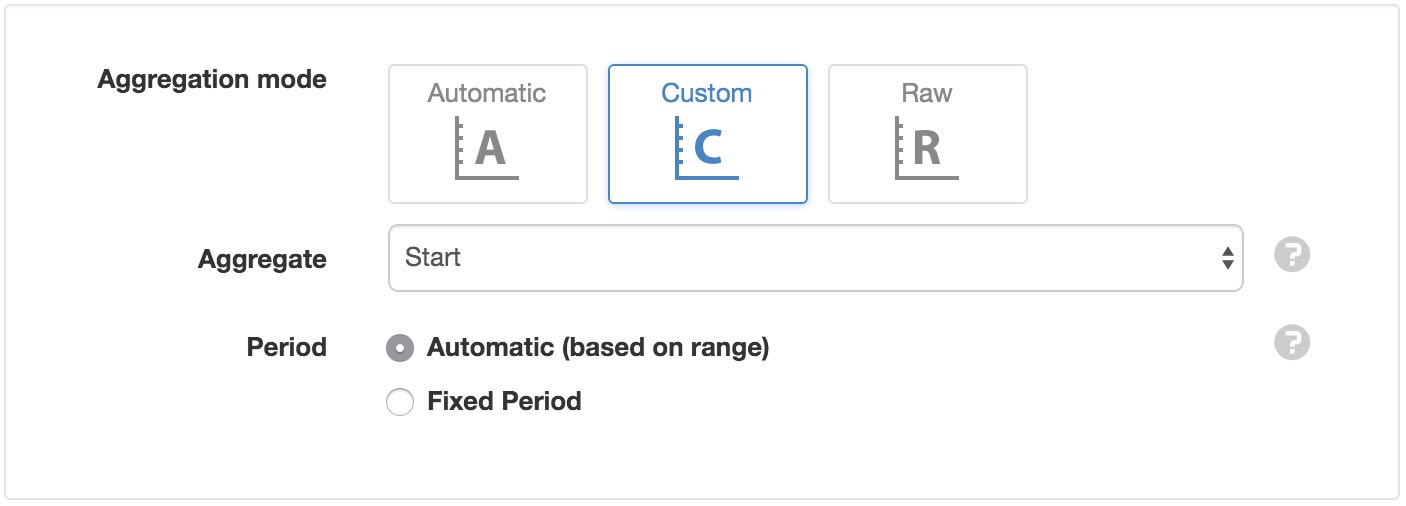
- Automatic
- Automatic allows the chart to determine the most suitable period based on the chart range.
- Custom
- Custom requires the choice of aggregate type (which will be applied to the measurement data) and period interval (which will determine the timestamp of each series).
- Raw
- Raw uses the timestamps and measurements of the records directly as the series represented on the chart. However, as the maximum number of series that can be displayed on a chart is 15, while a typical data file could contain hundreds or thousands of individual timestamped records, some form of aggregation is generally recommended.
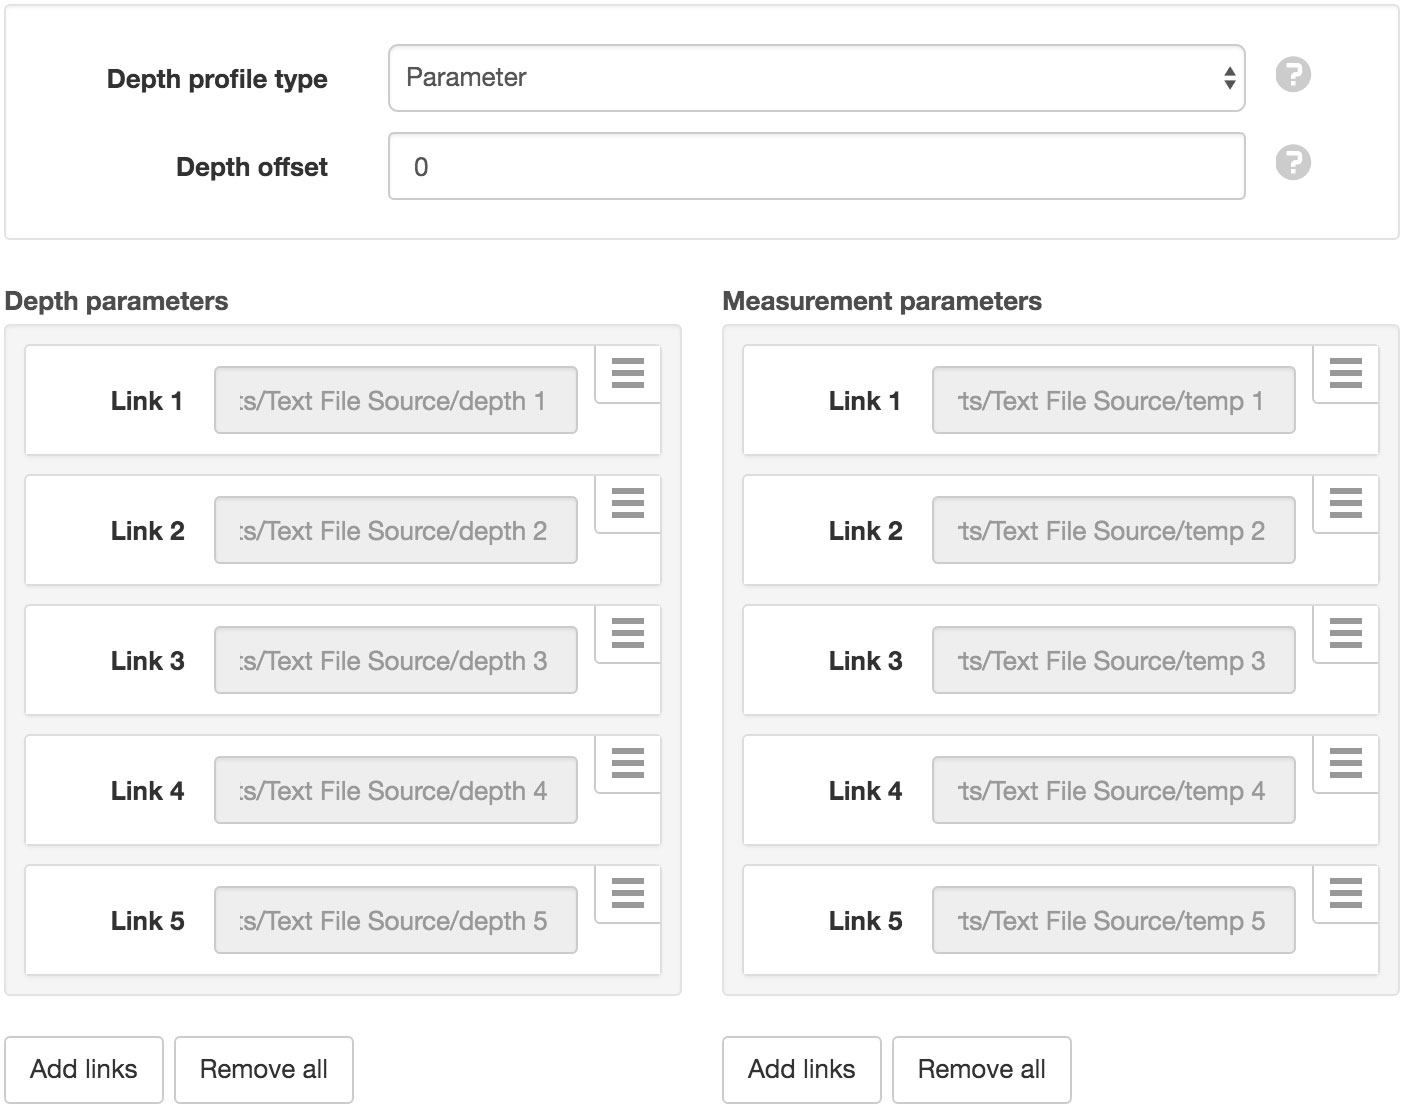
Profile & Links
Displacement charts require you to define a profile containing depths/distances with corresponding measurement parameters.
Choose from 3 profile type options:
Parameter
Set the profile type to parameter for dynamic depth/distance values based on time series data stored in linked parameters. Optionally specify a numeric offset to add or subtract from each depth/distance value.
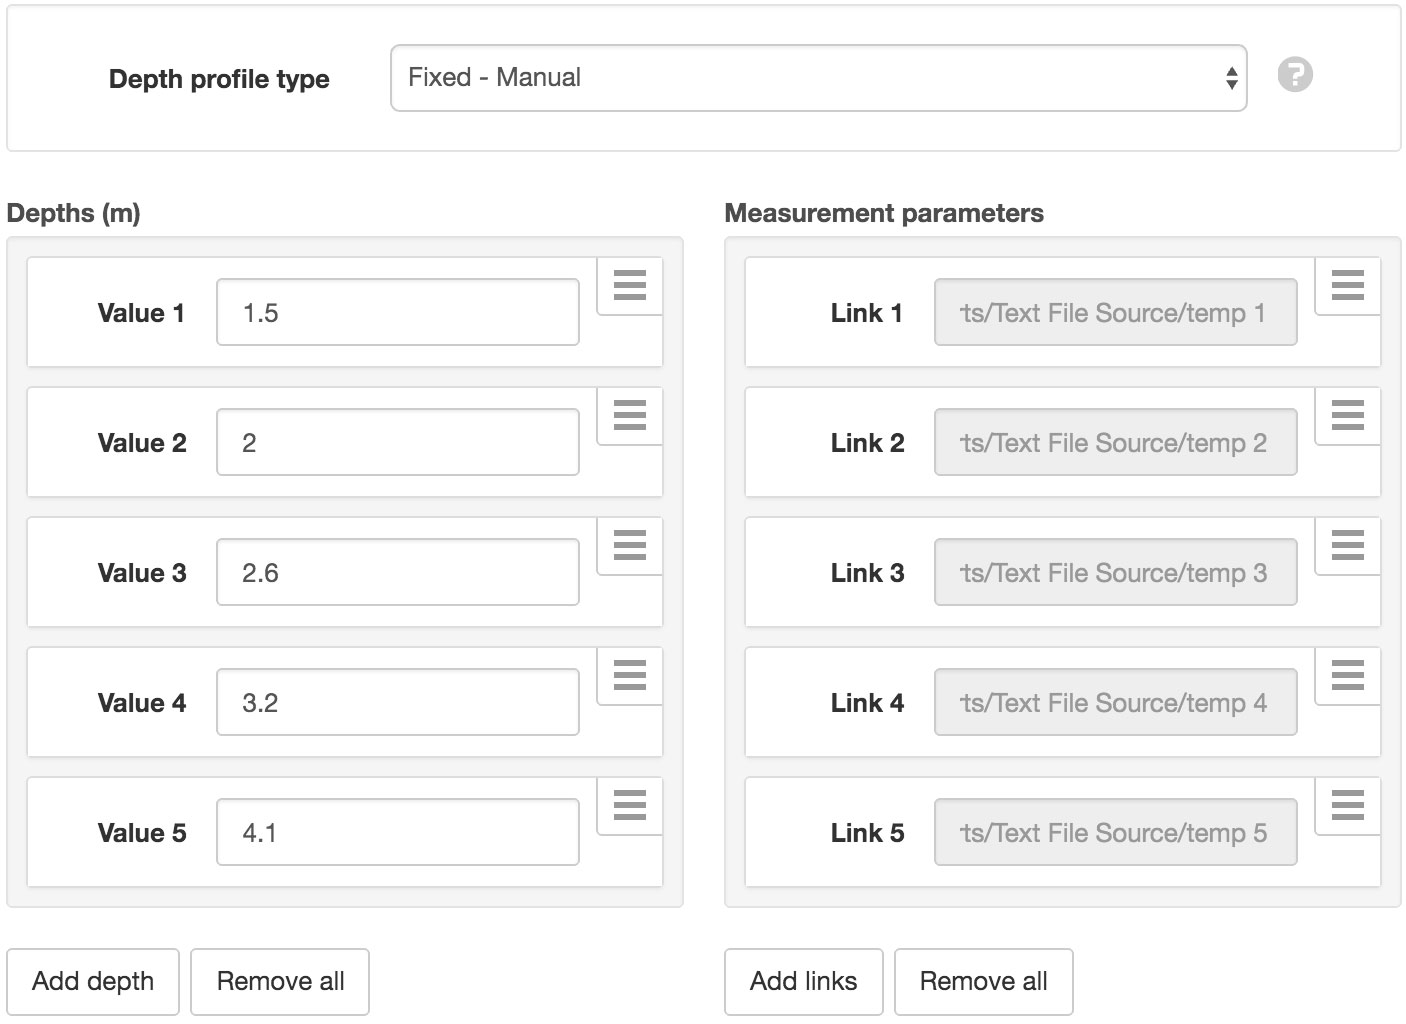
Fixed - Manual
Set the profile type to fixed - manual to manually define static depth/distance values.
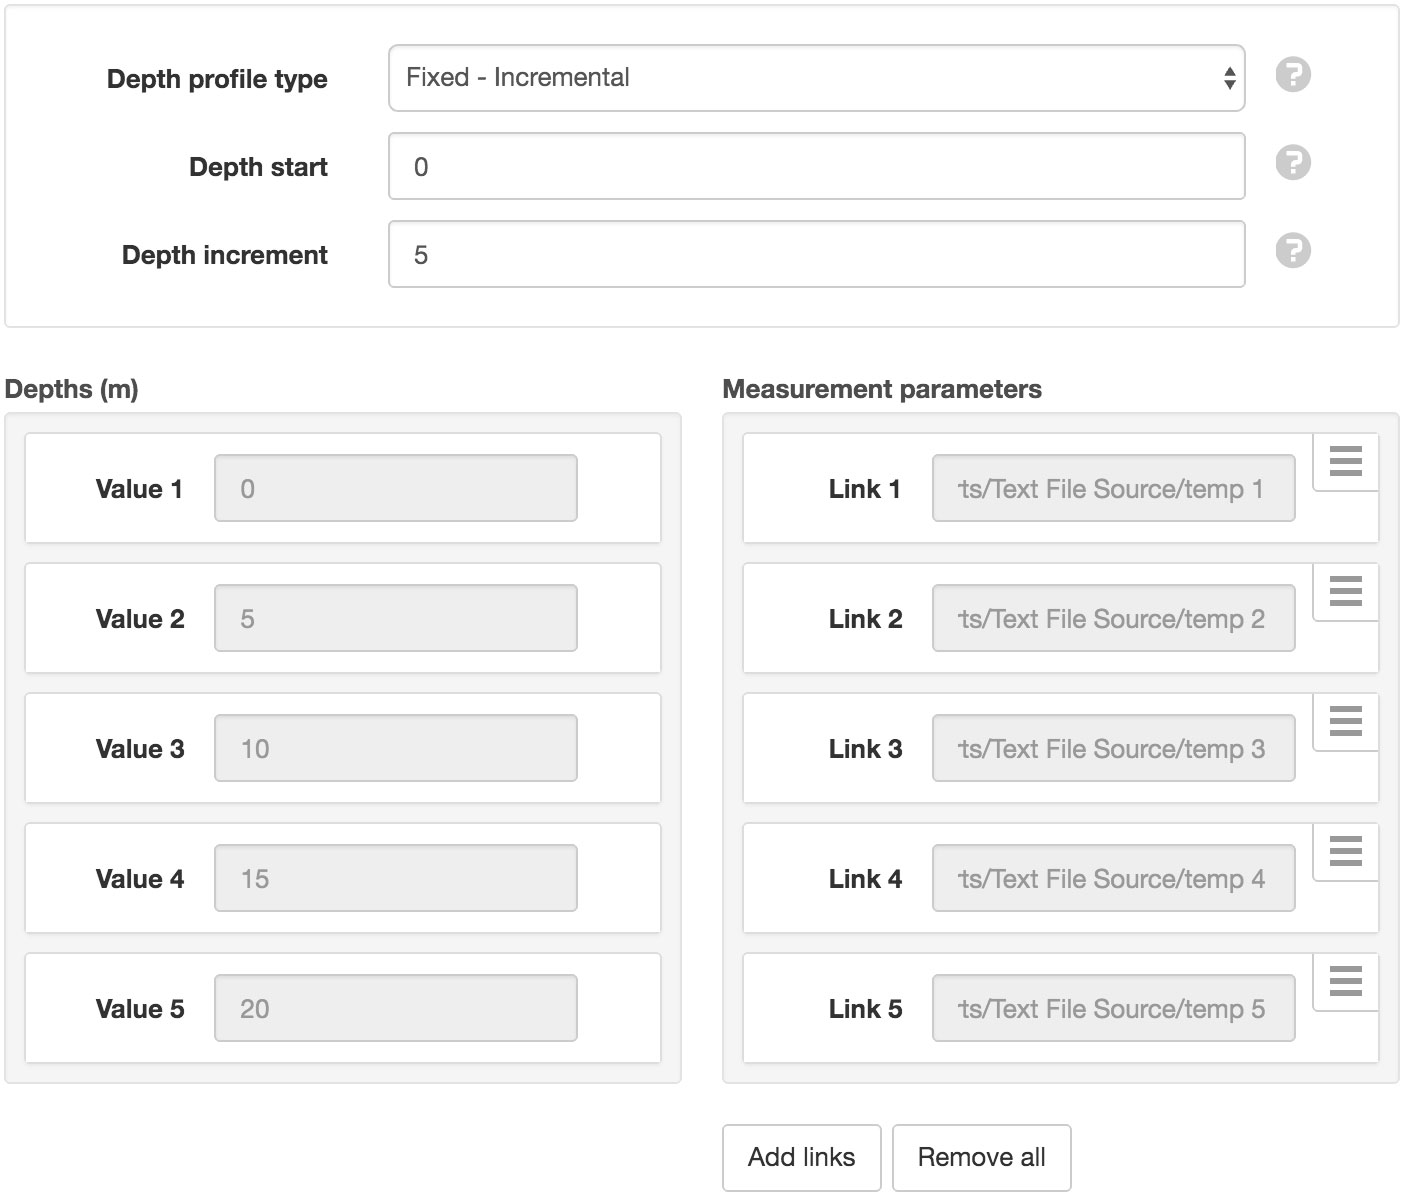
Fixed - Incremental
Set the profile type to fixed - incremental to automatically generate depth/distance values using start and increment values.
Drag and drop items in each list to re-order. Links and Values can be updated or removed via the dropdown menu (accessible by clicking the menu button on the top-right corner of the item).
Charts can not have links to Nodes in different Workspace and currently do not support the same nodes being linked more than once to the same chart.
Note
You must ensure each depth/distance has a corresponding measurement in the correct order. eg. ‘Measurement Link 1’ is associated with ‘Depth Link 1’, etc.
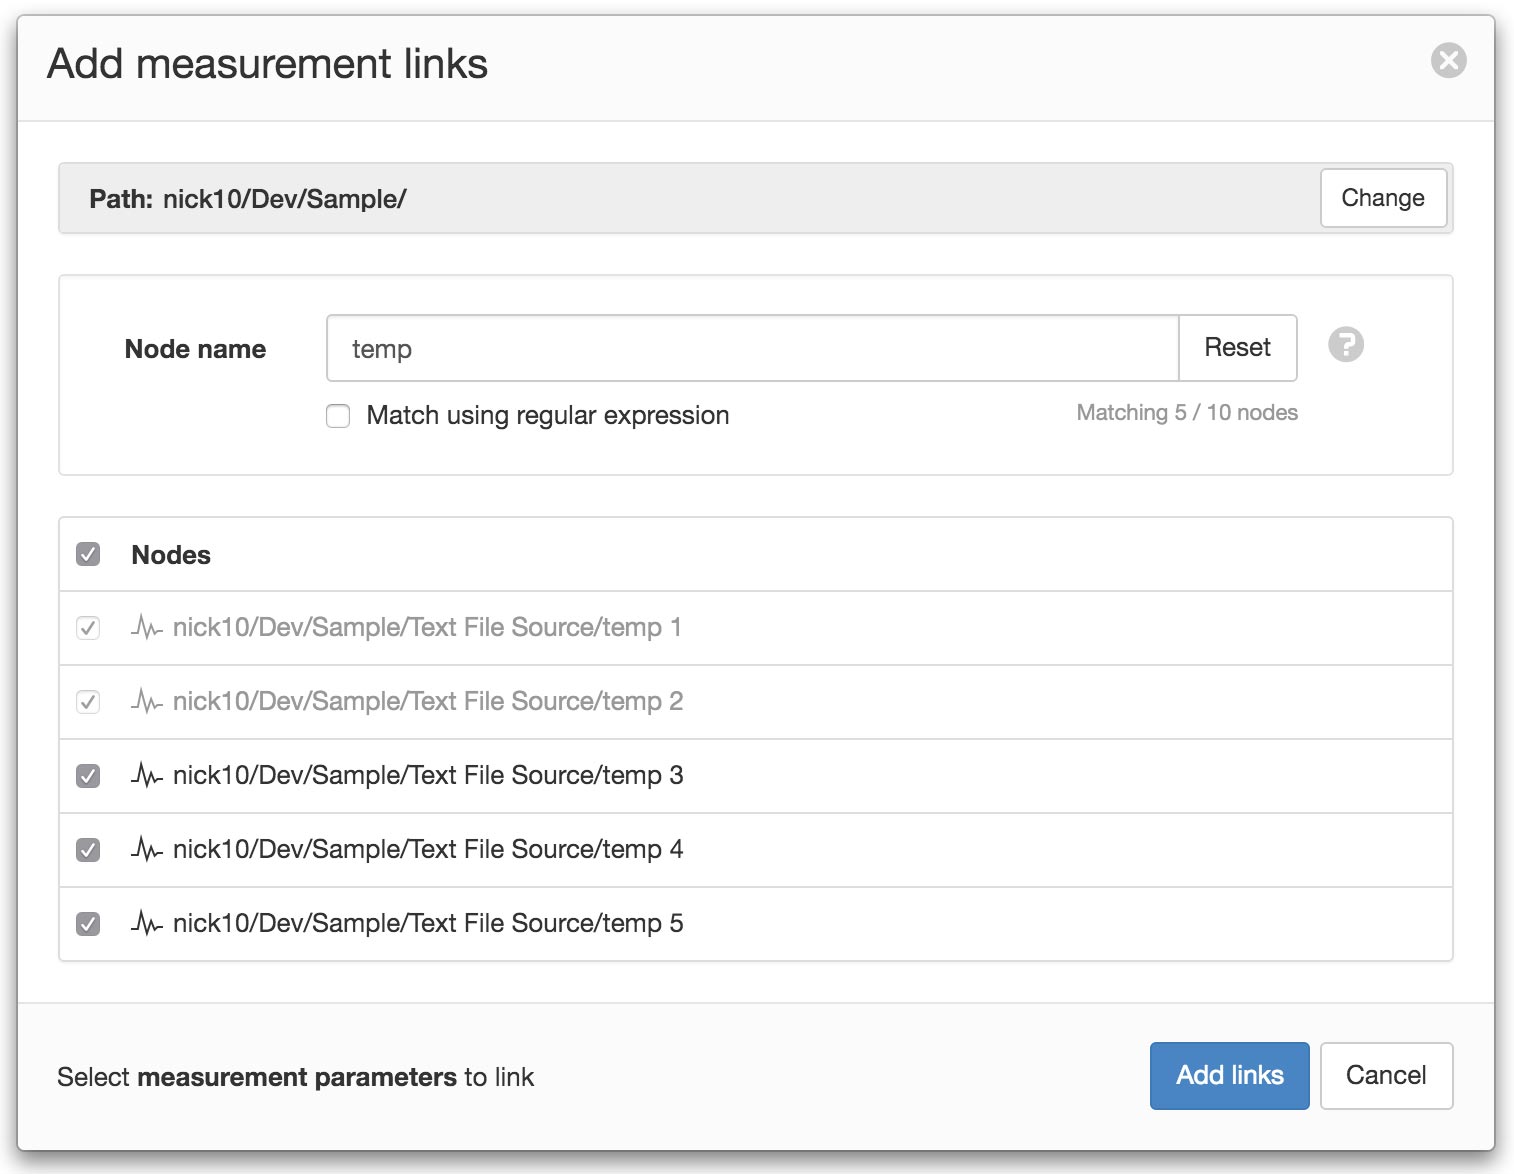
Use the Add links button to link multiple parameters at once. The Nodes list will display all parameters under the current Path. Click the Change button next to the path to select an alternate (or higher) node in the current Workspace.
You can filter the list by typing part of a parameter name in the Node name search field. Parameters that have already been linked will be shown as disabled in the node list.
Use the checkboxes to select the parameters you would like to link and click Add links.
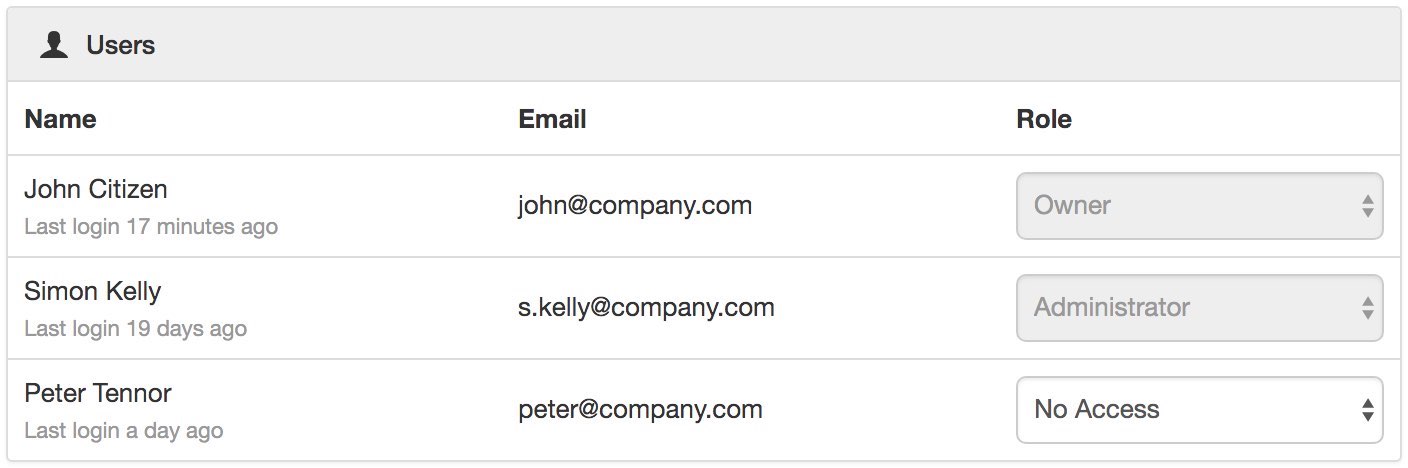
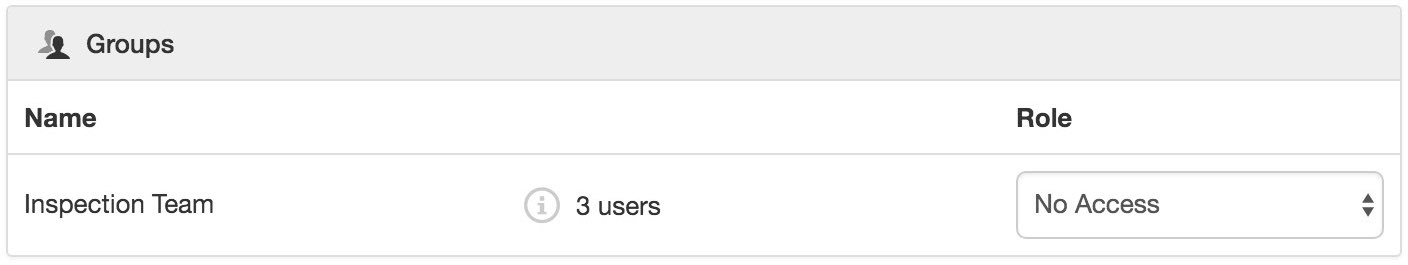
Security
The Security section displays a list of all users and groups that have access to the Node. Users with security permission can restrict user and group access to the node and its descendants by assign the No Access role.
New users and groups must be added via the Workspace Security section.
Note
The Account Owner, Administrators or Workspace users/groups that have been assigned a Workspace role with the configure permission can not be assigned the No Access role.
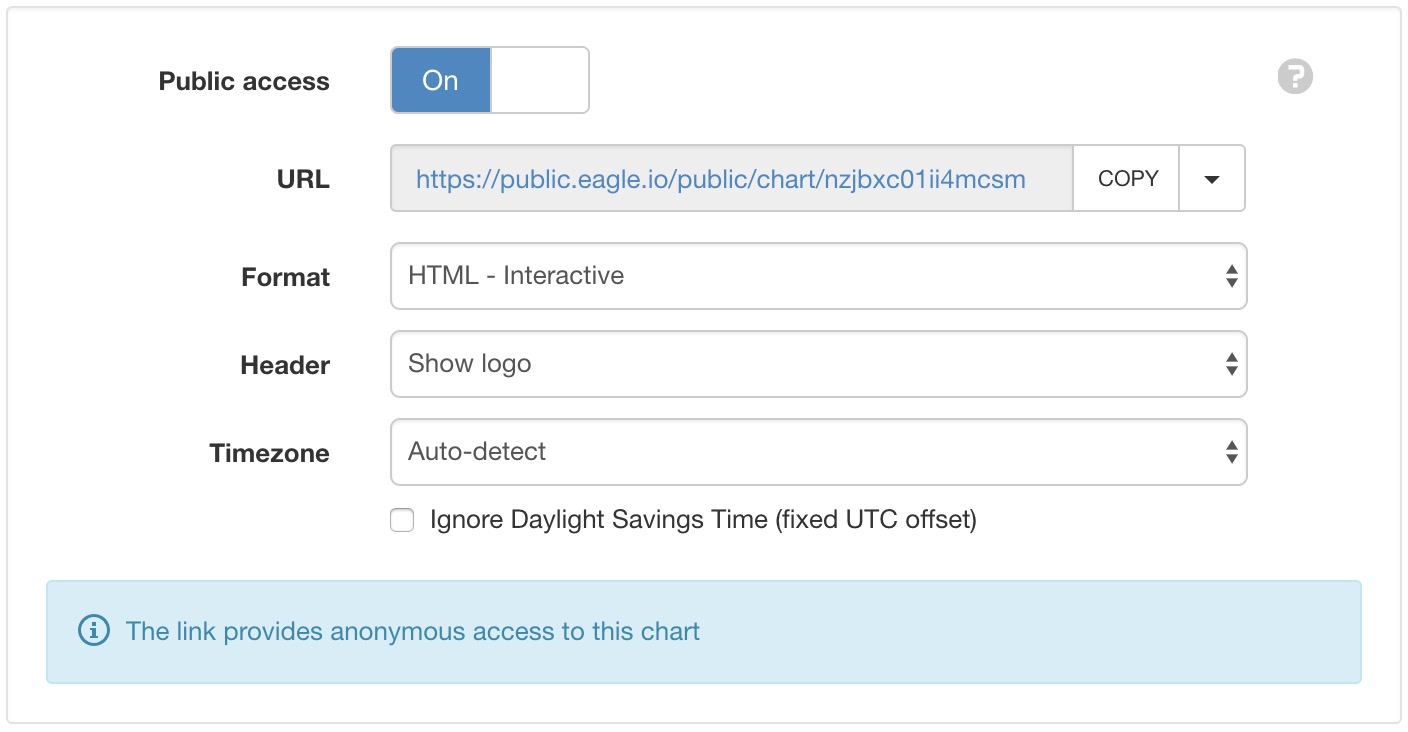
Public Access
Enabling public access allows anyone to view the node (attachment, chart, dash, report or historic data) using the generated URL.
You can also embed charts and dashboards into your own website with basic HTML. Select Copy embed HTML from the URL dropdown menu for a generic code snippet (you will need to paste this in to your website). You can also revoke and replace the automatically assigned URL by selecting the Generate new URL option in the menu.
Use the available options to customize the URL based on your display preferences. These options are transient and you can use multiple variations of the URL at the same time.
Note
This feature is not included in Starter accounts.
Drag and Drop Links
Nodes can be dragged with a mouse directly from the Workspaces Tree and dropped onto applicable charts (indicated with drop-accept and drop-blocked mouse cursor icons).
Note
Parameters will be automatically assigned as either depths/distances or measurements based on parameter names. You should review the profile & links from the properties dialog to ensure correct assignment and ordering.
Copy/Paste Charts
 Copy/Paste operations can be performed from the Workspaces Tree to quickly duplicate one or more charts. Links are automatically re-assigned to corresponding Nodes relative to the Chart if they exist at the destination. ie. You can copy/paste complete Locations containing charts without manually re-assigning all links.
Move Charts
 Moving a chart within a Workspace will keep existing links. Moving a chart between Workspaces will invalidate any Link where the linked node is not available in the destination Workspace.
Link error
 If a linked Node is removed or not accessible after a copy/paste or move operation then the Chart will display the Link error icon to indicate a problem with one or more Links. Links can be removed or reconfigured from the Profile & Links section in the chart properties dialog.